Tag Archives: Urban Form

County Size, Part 2

In a previous post, we looked at county sizes across the US based on their land area. Let’s do a quick follow up and look at county size based on population.

There are 3,142 counties (and county-equivalents) in the US. Because there are many counties with small populations and relatively few counties with very large populations, it makes sense to group them on a logarithmic scale. We’ll look at the number of counties in each of the following population ranges:

  • Below 1,000 (<1k)
  • 1,000-10,000 (1k-10k)
  • 10,000-100,000 (10k-100k)
  • 50,000-100,000 (50k-100k)
  • 100,000-500,000 (100k-500k)
  • 500,000-1,000,000 (500k-1m)
  • 1,000,000-10,000,000 (1m-10m)
  • 10,000,000 and up (>10m)

The number of counties in each range is shown below.

countysize

Over two-thirds of counties have population less than 50k, with almost half of all counties in the US falling into the 10k-50k range. There are 42 counties with 1m-10m people, and of course, one unique county with over 10m 😉

Some other interesting data points on county sizes:

  • The average county size is just over 100k (101,482 to be exact).
  • The median county size is 25,715 (half of all counties have a smaller population).
  • The population weighted average county size is about 1,150,000.
  • The median American lives in a county with population 473,279 (Staten Island). Half of all Americans live in larger counties and half live in smaller counties.

Here’s the breakdown by how many people live in each range, along with the population change for each range from 2010 to 2014:

countysize2

The striking thing here is the difference in population growth. Counties under 50k people shrank, and counties in the 50k-100k grew slowly, at 1.29%. Population growth was much stronger in counties above 100k people. Even LA County, with its high housing costs and large population base, grew at almost 3%, just below the national growth rate of 3.07%. The fastest growth was in the 1m-10m range, followed by the 500k-1m range.

I wanted to investigate in a little more detail, so for each population range, I sorted counties by growth rates. The table below shows the results

countysize3

For the three groups below 50k (under 1k, 1k-10k, and 10k-50k), about two thirds of counties lost population between 2010 and 2014. For the 50k-100k range, just over one third of counties lost population. For the 100k-500k range, just under 20% of counties lost population. Of the 136 counties with population above 500k, only 6 lost population. These were Wayne MI (Detroit), Cuyahoga OH (Cleveland), New Haven CT, Monmouth NJ (NYC burbs), Montgomery OH (Dayton), and Camden NJ.

This stark difference between small counties and large counties reflects recent trends in the US of large metropolitan areas gaining population while rural areas and small cities struggle or decline.

The US is a big place, and it would foolhardy to try to come up with overarching reasons. Different regions struggle for different reasons: rural counties in the High Plains have been shrinking for decades due to the inherent difficulty of dryland farming, small industrial cities have not been able to renew themselves the same way larger cities did, and coal mining counties in places like West Virginia have been hammered by low coal prices.

At a macro level, no one really knows how to create local economic prosperity in these places. Many people expected better communications technology (the internet) to make small cities and rural areas more connected, making it easier for people to work remotely and spread prosperity. That hasn’t happened. Why is anyone’s guess. For now, the important thing for those of us in large counties is to support policies that allow the creation of more housing, to allow people from small cities and rural areas to be able to move to places where they have more opportunities.

Moving the Goalposts

Moving the goalposts is a well-known political tactic, where you change your standard of success in response to worse than expected results from your policies (or better than expected results from your opponent’s policies). For example, you might start with the goal of catching a certain criminal dead or alive, but when you fail to do so, restate the scope of the mission to diminish that person’s importance. Or you might keep adjusting the budget and schedule for an infrastructure project so that no matter the cost and completion date, you proclaim it finished on time and on budget.

Opponents of urban development like to do the same thing. For example, considering only the fury rained down on “McMansions” by certain op-ed columnists, you might think the City of LA had been totally unresponsive to homeowner concerns. But in fact, the city already had a “mansionization” ordinance from 2008 and has rushed additional interim measures into place. The noose will be further tightened when final updates are made. However, there should be little doubt that in a few years, the new “mansionization” ordinance will still prove too liberal, and homeowners will be back raging for further controls.

The rationale is similar. If you view politics as a zero-sum game, no amount of success for the opposition is acceptable. Success will be continually redefined until the opposition can be shown to have none. Likewise, there is no amount of redevelopment that many NIMBYs consider acceptable except for none. If a land use regulation makes development more difficult, it will initially be hailed as a success, but if some development continues to occur, the regulation will be deemed to have come up short. The goalposts will have moved.

For another example, in 1986, Prop U downzoned much of LA’s commercially zoned land from FAR 3.0 to FAR 1.5. The lower FAR has proved to be an insurmountable barrier in many areas. However, LA continues to be a desirable place to live, and rising home prices have put development pressure on some commercially and industrially zoned land. Sure enough, some are now proposing to downzone from FAR 1.5 to FAR 0.75. The goalposts move.

If you care about urban economic growth, or affordable housing and gentrification, the best you can ever hope to do by working with these opponents is fight defensive actions. You can slow down their march to zero growth or the loss of affordable housing, but you can’t change the destination. In many cities, opponents of development have organized so powerfully that there is little else the city can do at the moment.

In the long run, you can’t keep giving pieces away to people who will only be satisfied when they have it all. Eventually, you have to stop the goalposts from being moved in a way that works against your interests.

Walkabout: Naebang, Seoul

If you’re a politician, a big fancy consultant, or a global thought leader, what to do you do when you visit a major city in another part of the world? You probably fly into Shiny New Airy Spaces International Airport, hop on the Global Thought Leader High-Speed Rail Line, and head downtown where you visit a bunch of places with high-end amenities and architectural showpieces like stadiums and convention centers.

Then you come home, pass through an old, congested airport terminal, and stand on the curb breathing exhaust while you wait for a car service to pick you up, since very few US airports have high quality rail connections.

Any wonder that US politicians and global thought leaders are obsessed with airport transit and convention centers?

The problem is that as an international traveler, the way you experience a city’s transit system is very different from the way that ordinary people experience it. Most people riding transit aren’t going to the airport or convention center or stadium very often (unless they work there). The vast majority of transit riders are trying to go about some mundane daily business – going to work, school, or shopping – in the places that the system serves.

So, what should you do if you want to experience a city the way residents do? Easy, just get out a rail map, pick a random stop, get off there, and start walking around. If I have time and the system isn’t too expansive, I like to try to pick one midline stop and one suburban terminal. (In theory, this works just as well – if not better – with buses, but it’s often harder to figure out the frequently and span of service for bus routes on an unfamiliar system.)

Objection!

You want me to just pick a random stop that I don’t know anything about? Yes. In fact, this really doesn’t work in a city you know, since you probably have preconceived notions about the neighborhoods around most of the transit stops. The goal is to learn things you wouldn’t learn in a structured exploration.

What if I pick a boring neighborhood with nothing to do? Even better; you’re learning about a part of the city that the tourist bureau doesn’t want to show you.

What if I don’t speak the language? Even better! Now you’re experiencing a city the way recent immigrants might.

What if I pick a dangerous neighborhood? This is a potential concern. In general, many Americans (especially a certain generation that rhymes with Maybe Doomers) overestimate the level of danger in cities. Go during the day when it’s light out, and just act naturally.

What if I get lost? You have a smartphone, don’t you? Before you head out, scroll around the neighborhood in your maps app to load a bunch of data into the cache (phone memory) so that you can see where you are even without cell service. Also, there seems to be a lot more free WiFi in some countries, and you can almost always find a local restaurant or coffee shop that has WiFi nowadays.

If the stop spacing on the rail network is reasonable – like say, a mile or so – you can plan to walk between two stations, which helps give you a feel for what the city is like a little further from a transit node.

Okay, enough introduction. Here’s what I saw when I had a free day in Seoul, and a random jab at the map led me to Naebang.

Naebang Station

Seoul is a very dense city, so no matter where you go, you’re going to see some urban environments. I exited Naebang and headed east on Seocho-daero. (Note: streets in Seoul are often just numbered sequentially with a local neighborhood name, which can be a little confusing.)

Heading uphill, there’s this Flatiron-esque building on a triangular lot.

01-Flatironesque

This street is actually pretty wide an auto-oriented, like many modern arterials in Seoul. Neighborhood streets are a different story, as we’ll see later.

Seocho-daero leads you uphill and dead-ends; look back and you’ll be rewarded with some views. Urbanization in Asia is far more advanced than anywhere in the US outside Manhattan.

02-lookingback 03-lookingbackzoom

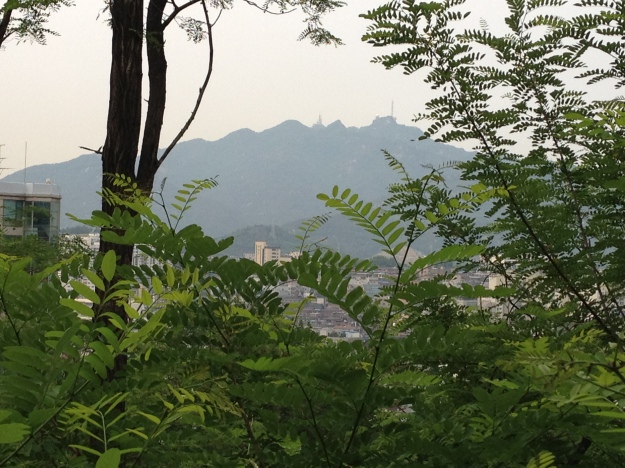
In the distance, you can see some green hills. Seoul’s dense urban environment is frequently broken up by hills, many of which form nice neighborhood parks. In a way it’s a little like. . .  Los Angeles. Is Seoul a glimpse of a future denser LA? A thought for another time.

04-corridorview

Turning around, it’s time to head up into Seoripul Park.

05-intopark

There are some nice, graded paths, but why not scramble up some rocks when you can?

06-rocks

Just a little ways up, I reconnected with the main path through the park.

07-nicepaths

Seoul is dry in the winter, but has a summer monsoon that dumps a lot of rain. That keeps things very green in the hills.

08-thruleaves 09-overtreetops

So. . . dense. . . and yet the parks provide a real escape from the city.

10-sodense

Alright, now we’re back out into some steep streets fronting up onto the hills. I like the merciless use of overhead power distribution. Also, it does snow in Seoul in the winter, pretty regularly. Next time I go, I want to go in winter and see how people navigate those hills in snow.

11-outofpark

Off of the arterials, you can see part of how Seoul achieves such density – really narrow side streets.

12-lookingdown

Of course, all those towers help too.

13-towerstowers

I kept walking downhill. Narrow streets and mid-rise development abound.

14-midrise

And hey, I was able to find where this is in Google Maps!

I kept wrapping around the hill on the street, into a neighborhood that looked a little more upscale. Nice sidewalks!

15-nicesidewalks

The building on the left was completed after Google street view’s last pass.

16-newbldg

Seoul – not scared of funky design.

17-funky

Oh, and one more thing: all those mid-rises in the upscale neighborhood? They’re all podiums with parking on the ground floor. Ha!

Bizarro Randal O’Toole

Reading Randal O’Toole if you care about the growth of cities is often an exercise in frustration. (I do it for two reasons – to know what the opposition is saying, and because you never know where you’ll find good data or ideas.) The really frustrating thing is that he frequently lays out principles that seem to favor dense development in some cities, but still manages to convince himself that single-family residence (SFR) neighborhoods never disappear unless urban planners force them out.

I think part of the problem is that while his analysis might be relevant to Portland, as he lives in Oregon, he applies the same conclusion to places where it’s only part of the story, like SF, and places where it’s almost irrelevant, like LA. For example, it seems unlikely the Pearl District would develop the way it did without tax subsidies. O’Toole is right that subsidizing this development is bad policy, and hurts the ability of the city to provide services to other neighborhoods. And no doubt, the fields and rolling hills south of San Jose would be turned into housing if permitted. But when it comes to SF, he’s all like “just how attractive and hospitable will San Francisco be after all of its single-family neighborhoods have been replaced by mid- or high-rises?” Well I don’t know, how popular would Doritos be if they replaced Cool Ranch with Kimchi? Only way to find out is give people a choice and see what happens, right?

The other problem with O’Toole’s analysis is that it’s rarely mentioned that one of the driving motivations behind zoning is “protecting” or “preserving” SFR neighborhoods from development, usually at the insistence of those neighborhoods. If planners are guilty of trying to force dense development in some areas, they’re just as guilty of trying to stop it elsewhere.

With that in mind, I present you with Bizarro Randal O’Toole. Bizarro O’Toole starts with the same assumptions yet ends up with different priorities regarding the problems facing cities.

bizarrochart

You get the idea. I’m going to start calling it a “Bizarro O’Toole moment” any time I realize I could use his arguments in favor of denser urban development.

*I’m aware that O’Toole has written several papers in favor of funding freeways with tolls. However, while he frequently criticizes specific transit projects, I don’t recall seeing any editorials against useless rural freeways, of which there are plenty.

Torre David: What is an Informal Community?

Almost a year ago, Torre David briefly flashed through the US city planning universe, thanks to an article on Atlas Obscura that linked to a short film.

Torre David refers to a complex of high-rise buildings in Caracas that were abandoned in the middle of construction in 1994 when the Venezuelan financial sector collapsed. By historical accident, the project was suspended at a point where the buildings were substantially complete. The structural frames and floor slabs were done, stairs (but not stairwells) were finished, and portions of the curtain wall had been attached. The site sat in suspended animation for 13 years until a rainy night in 2007, when people evicted from another squat converged on the tower. The guards relented and allowed them in.

Torre David: Informal Vertical Communities (Lars Muller Publishers) by Alfredo Brillembourg and Hubert Klumpner, with photos by Iwan Baan, offers an attempt at the detailed study warranted by this unusual community. The book is split into four main parts: Past, Present, Possibility, and Potential, including a graphic novella in the first part.

Past and Present

Thankfully, the overwhelming majority of the book is dedicated to the past and present of Torre David, allowing the community’s history and present condition to speak for itself. The authors also provide geographic and social context for Torre David – its place in Caracas, the geography and growth of Caracas, the impact of political upheavals such as the policies of Hugo Chavez. The photographs, for their part, are simply stunning.

The authors are the cofounders of Urban-Think Tank, and Chair of Architecture and Urban Design at the Swiss Federal Institute of Technology in Zurich, lending a heavy architectural influence to the analysis. In this regard, the book truly shines. Crisp graphics paint a clear, detailed spatial picture of the buildings. The researchers have surveyed every occupied floor of each building in the complex, including the ingeniously improvised electrical and water systems. Flipping back and forth through these graphics, one can’t help but lament that similar respect wasn’t shown to that other famous informal vertical settlement, the Kowloon Walled City, before it was demolished.

Physically, the complex consists of a ten-story parking garage, an atrium intended to be the main entrance, and three buildings. The buildings are known as Edificio A (the 45-story high rise most often referred to as Torre David), Edificio B (19 stories), and Edificio K (19 stories, connecting the parking garage to Edificios A and B on floors 6-17). Access is via the parking garage, where residents can hire taxis or motorbikes to take them up to the tenth floor, then through Edificio K and across vertiginous 12-inch gap in the floor to Edificios A and B.

The initial occupation focused on Edificio A, now occupied up through the 28th floor, which offers a gym and children’s play space with an airy view. Vertical circulation is through only one staircase, with the other staircase having been converted to a shaft for utilities. Recently, apartment construction has been focused on Edificio B and the Atrium (imagine building an apartment on one of the upper levels of your local indoor mall). In addition to apartments, there are also several small stores, a hair salon, and a church.

Most media refers to Torre David as a vertical slum, but the photographs reveal a wide size and variety of housing. Apartments near the edge of the structure are more desirable, since they offer better natural light and ventilation relative to those near the building core. Apartments range from several bedrooms down to what US city dwellers would know as singles, bachelors, and studios. As time passes, apartments are upgraded with amenities like bathrooms, kitchen sinks, dishwashers, and clothes washers.

Some apartments are undeniably spartan, with minimal furnishings, unfinished concrete floors, walls of large red clay bricks, and no ceiling other than the preexisting steel trusses and concrete deck. However, other residents have invested a significant amount of time and money into their dwellings, installing linoleum floors, floor or wall tiles, and drop ceilings. You could post these places on Craigslist in New York or San Francisco at normal rents and have a lot of interested inquiries. (Actually, how many people in New York or San Francisco would like the opportunity to get an unimproved space and turn it into an apartment over time?) And in any case, however improvised the tenant improvements might be, residents of Torre David have a solid roof over their heads and solid floor under their feet, something not enjoyed by all barrio dwellers.

Converging on Formality

The authors call Torre David an informal vertical community, but it’s an interesting question to ask what we mean by formality in the first place. Certainly, the residents of Torre David do not submit plans to the Department of Building and Safety and dial them up for shower pan inspection when building a bathroom. Yet it would also be inaccurate to describe Torre David as chaotic or anarchical. Far from it.

From the very beginning, the viability of the occupation of the complex depended on social networks. On the day it was initiated, it depended on the ability of squatters to muster a large enough crowd that the complex guards assigned to keep people out would be overwhelmed by the volume of human desperation confronting them.

Torre David also has its own bureaucratic structure, which the authors describe as an authoritarian democracy. The governing cooperative, the Asociasion Cooperativa de Vivienda “Casiques de Venizuela” RL, was officially registered in 2009. Most residents are Evangelical Pentecostal Christians and attend services in the complex church, presided over by Alexander Daza, who is also the president of the cooperative. (The book is notably silent on Daza; perhaps this is the price of access, perhaps he is simply not that interesting.) An inner circle around Daza makes decisions, and then lower level of leadership and floor coordinators work with residents to maintain space and utilities.

Each family pays $15 per month to the cooperative for services including electricity, water, and security. Utilities were pirated at first, but the cooperative now purchases them and employs its own crews to maintain the electrical and water systems of the buildings. The cooperative also employs its own security guards to control access to the compound. Residents can be evicted if they accrue enough violations of a general code of conduct.

The cooperative has guided development of the complex – for example, it has decided that no space above the 28th floor of Edificio A will be occupied. In the beginning, anyone could apply for occupancy every Monday from 5pm to 8pm; now, few new residents are admitted unless there is a vacancy. When the first residents moved in, they lived in tents while they outfitted new apartment space, but that practice was ended in 2012.

The development of social and bureaucratic networks is fascinating, and makes one wonder how we, as a society, decide what is and what isn’t a formal community. The cooperative exists in a very strange place, as a legally recognized entity that does not officially own the property it manages. Yet the increasing formality with which the cooperative approaches development suggests that if the government doesn’t exist, you have to invent one. Torre David may be called an informal squat, but the cooperative provides services in exchange for mandatory fees, enforces socially accepted laws, provides security, and considers resident input. Is that not a formal community? Is that not a government?

Possibilities and Potential

The analysis of possibilities and potential is notably weaker, but overall still interesting and well-done. Happily, the authors largely avoid the impulse to shoot the moon with big, costly design-based solutions, instead focusing on incremental improvements to residents’ lives.

For example, the construction of a dumbwaiter system  in the existing elevator shafts offers great potential. They are mechanically simple, low-cost mechanisms that the cooperative could afford to maintain. They would alleviate the significant burden of climbing and transporting all goods up the stairs from the top of the parking garage on the 10th floor to the 28th floor. This would allow the cooperative to make use of the higher floors of the building for new apartments.

Incremental improvements to water and wastewater systems would also be beneficial. The lower levels of the parking structure often flood during rain storms, and the wastewater system was never finished properly.

However, for better or for worse, we are all captives of the age we live in. While the book does have a  beneficial focus on working with residents to improve the complex, it also incorporates some of the questionable trends in modern planning.

For example, the authors note the unreliability of electric supply in Caracas, and in the name of sustainability suggest that the upper portion of Edificio A be outfitted with an array of small windmills that would provide power and run a pumped hydro energy storage facility. I’m not sure residents need to be dealing with construction and maintenance of wind-generation equipment on the side of their building. I’m also not sure why this is a sustainable solution, since it’s not available to the much larger portion of low-income Caracas residents that live in low rises. And I fail to see why sustainability should entail generating all of a building’s energy on-site. Why not generate it wherever it can be most efficiently generated? (The pumped hydro is pretty basic and could be used without the wind generation.)

I’m also not crazy about the aerial tramway concept. This technology has a place where topography and existing development make bus or rail transit impractical. However, the capacity of an aerial tram system is smaller and its geographic scope is going to be more limited.

Still, on the whole, the authors do a decent job with these sections. Maybe it’s just me, but I’m far more fascinated by how communities evolve on their own terms.

The Human Touch

If there’s anything missing from the book, it’s the human touch. Whereas City of Darkness tells the story of Kowloon Walled City through stories and interviews with former residents, leaving one to wish for better spatial understanding, Torre David provides a complete spatial analysis and a summary of the social structure, without much in the way of personal stories.

Perhaps, as a more complete social and economic unit than Torre David, Kowloon Walled City lends itself to a greater diversity of stories. Torre David is essentially just a residential building, with a few small retail establishments serving residents, while Kowloon Walled City was home to an astonishing variety of retail shops, noodle and fishball producers, metallurgists, dentists and doctors, and small factories.

But even at that, there are thousands of people living in Torre David, and it would have been nice to hear some of their personal stories – where they came from, why they chose to move to Torre David, how they view the community, their hopes for the future. It may be that it was easier to get Kowloon Walled City residents to open up, since the city’s fate had already been determined when City of Darkness was written. Residents of Torre David hope to stay in their adopted home, to which many view their claim as tenuous at best. Marginalized communities – or communities that have been labeled informal – are rightly suspicious when those who determine what is formal show up.

Buy This Book

If you’re interested in how urban communities emerge and evolve, spatially and socially, I recommend buying this book. When I got it last year, you had to order it through the Swiss publisher, but it looks like it’s available on Amazon now (and if the going price for City of Darkness is any indication, you might as well buy it as an investment). It’s a fascinating look at both an architectural anomaly and a developing urban community.

Note: for a substantially contrasting analysis of the tower, see this Jean M. Caldieron article.

What Are City Planning’s Goals?

In Chapter 10 of Human Transit, Jarrett Walker writes about the contradictory missions faced by many transit agencies:

Coverage: serve all parts of our community.

Ridership: maximize ridership with our fixed service budget.

It is one of the most fundamental insights of Human Transit that, while reasonable and achievable when stated separately, these goals cannot be executed simultaneously. Thus, agencies usually face criticism on both counts: that they are not serving low-demand parts of the city well enough, and that they require too much subsidy per rider. Note that, all other things being equal, it is impossible to improve on both measures at the same time – doing one works against the other.

City planning, as we have currently constructed it, also faces contradictory missions – an urbanism equivalent of “fast, cheap, or good – pick two”. In coastal regions of the US, we have assigned city planners with three primary missions:

  • Stop sprawl: slow the conversion of rural land into suburban developments of single-family homes and low-rise commercial.
  • Protect existing neighborhoods: prevent changes that current residents find discomforting, such as construction of apartment buildings or “McMansions” in single-family neighborhoods.
  • Affordability: ensure that a variety of housing types are available so that everyone can find a place to live without spending a burdensome part of their income.

Any two of these goals can be executed well together:

  • Stop sprawl and affordability: you can do this if you increase density in the existing built-up city. Who does this well? Tokyo. And Toronto! You can buy a brand new condo in a high-rise in downtown Toronto for barely $200,000. Read it & weep, coastal elites.
  • Protect existing neighborhoods and affordability: you can do this if you unabashedly sprawl out. Who does this well? Sunbelt cities, like Phoenix, Dallas, Atlanta, and any place in North Carolina.
  • Stop sprawl and protect existing neighborhoods: you can do this if you don’t give a crap about how expensive your city gets. Who does this well? San Francisco, obviously. London, again obviously. This is where Boston might end up, too.

Notice that I didn’t throw LA, or Houston, into any of these bins. LA’s development pattern until 1990 allowed both sprawl and densification of existing neighborhoods, much like Houston does today. And while “neighborhood protection” has become the NIMBY rallying cry in LA, and some inland cities like Norco and Redlands have “slow growth” regulations, the sprawl outlet is still very much available in Southern California. There’s not much stopping suburban development in places like the Victor Valley or the Antelope Valley – in fact, people like Lancaster Mayor R Rex Perris are out there trying to encourage it. The problem in LA is that the land where it’s easy to sprawl is too far from the locations with high job growth – even given LA’s polycentrism.

Walker writes in Human Transit that “eventually… the reality of the contradiction overwhelms the best rhetorical efforts”.

This is where we are with land use planning in California. Every city general plan, and every politician, will tell you that affordability is important. But when the steel hits the rails, that piece of land is too special to develop, that neighborhood can’t possibly support any redevelopment, and that building is too unique to be demolished. For a while, the terrible economy of the early 1990s and pre-existing housing slack masked the problem in LA, but no more.

Actions speak louder than words. No matter how loudly they claim to care – if they think Expo/Westwood and Expo/Western should stay SFRs forever, if they support the proposed downzoning in Echo Park, if they opposed the seven years and 8,000 page EIR in the making Bergamot Station plan – they don’t care about affordability in a meaningful way. The real world outcomes confirm that: the sprawl gets stopped, and the neighborhoods get protected, but housing prices and rents continue to rise.

Our current policies prioritize stopping sprawl and neighborhood preservation, with little regard for affordability. It’s important that we realize this and have this conversation. If you’re a renter in LA, you need to ask yourself how important it is to you that SFR owners are protected from change. Are you willing to pay higher rents for that? Because that’s the option you’re being presented. If that doesn’t sound like a great tradeoff, we need to do something about it.

LA Needs A Housing Boom

Stephen J. Smith of Next City and Market Urbanism recently published some great visualizations of growth in American cities since 1940, using animated GIFs created by Ian Rees (@woolie).

These graphics make the need for a large increase in housing supply abundantly clear, and I want to look at the LA images in more detail.

1950s

Growth between 1940 and 1950 was somewhat muted by World War 2, but in the 1950s, the suburban boom really took off.

la.density_1950_1960-mod

There’s growth all over the Valley, South Bay, and the Gateway Cities. The initial wave of suburbanization takes off in Orange County, and advances into the San Gabriel Valley as well.

Counter to the “LA is sprawl” narrative, there’s also a considerable amount of growth in built-up areas like Santa Monica, Venice, Long Beach, Hollywood, and what’s now Koreatown.

1960s

Here’s the graphic for the 1960s.

la.density_1960_1970-mod

Suburbanization in the Valley advances to Santa Clarita and Simi Valley, while construction in the Valley falls off. However, there’s still a considerable amount of apartment growth in places like Reseda, Sherman Oaks, North Hollywood, Van Nuys, and Panorama City.

Construction in southeast LA County tails off, while suburbanization in Orange County pushes south.

Note that there’s still a ton of construction in Koreatown, Hollywood, Sunset Strip, Santa Monica, and Venice, and a continuing boom in Inglewood and Hawthorne.

1970s

The same trend continues into the 1970s.

la.density_1970_1980-mod

Notice that in the 1970s, there’s actually an intensification of growth in the Valley, especially in Warner Center and the previously mentioned areas. Growth in Burbank, Glendale, and Pasadena also occurs.

Further east, the southern San Gabriel Valley and Pomona Valley start to grow.

Santa Monica and Venice continue to boom, and Palms is on an absolute tear, as are the beach cities of South Bay and Long Beach. Koreatown, Hollywood, and Sunset Strip all keep seeing a lot of construction.

In Orange County, suburbanization advances into Tustin and Irvine, but previously built-up areas continue to grow too.

1980s

In the 1980s, there’s still a lot of building going on, but you can start to see the wheels coming off, thanks to widespread downzonings.

la.density_1980_1990-mod

The Valley and Santa Clarita keep growing much as they did in the 1970s, as do Burbank, Glendale, and Pasadena. In the San Gabriel and Pomona Valleys, Diamond Bar and Chino Hills start to grow.

Thing start to quiet off on the Westside, but Santa Monica, Venice, West LA, and Palms still see growth. Koreatown keeps growing, but Hollywood and Sunset Strip decline noticeably.

Similarly, Long Beach and the South Bay beach cities see some growth, but a noticeable drop off. Meanwhile Hawthorne keeps growing.

With the exception of Irvine, things get much quieter in Orange County.

1990s

The 1990s are sort of LA’s lost decade, thanks to a punishing recession from 1990-1994 associated with defense spending cutbacks. The lackluster growth is somewhat forgivable in that regard.

la.density_1990_2000-mod

Koreatown, Hollywood, and North Hollywood see growth, but at a much lower level, as does Panorama City. Irvine and Tustin are about the only thing going on in Orange County. In the San Gabriel Valley and South Bay, it’s crickets. On the Westside, only West LA, Palms, and downtown Santa Monica see noticeable growth.

2000s

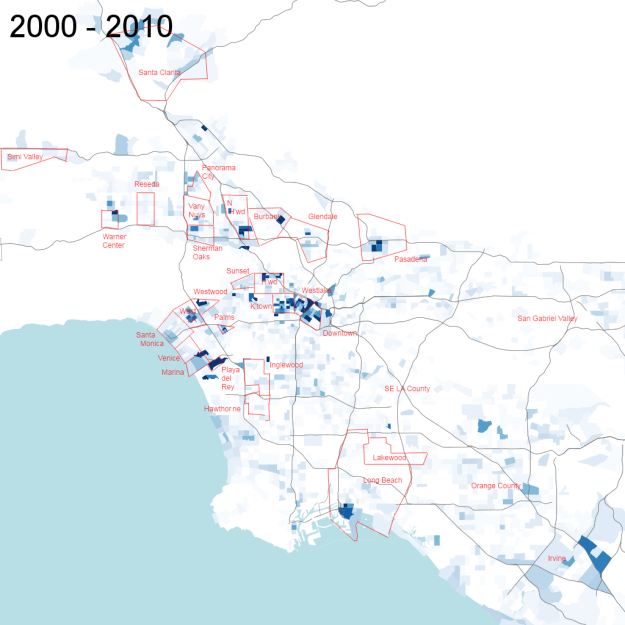
In contrast to the 1990s, the 2000s were a time of prosperity and rising prices. There’s no excuse for construction to be this low.

la.density_2000_2010-mod

There’s a little pick up in Warner Center, Sherman Oaks, North Hollywood, Burbank, and Pasadena. Koreatown and Downtown grow, but Hollywood construction falls off. On the Westside, there’s West LA, Palms, Marina del Rey, and Playa del Ray, but that’s it. There’s a suffocating lack of growth in southeastern LA County and the San Gabriel Valley, and except Irvine, Orange County isn’t much better.

Here’s the animated graphic with neighborhood overlays. (Update: to get the animated gif to display in the post, I had to rescale it to a smaller size. Drop me an email if you want the original size.)

la.densit.overlay-reduce2

LA Needs a Housing Boom Everywhere

This is why we’re in the hole we’re in on affordability. And when you’re in a hole, one of the first things you can do to help yourself is stop digging. We have a 20 year deficit of construction to try to make up. Increasing supply isn’t a cure for all our housing issues, but I don’t see how we have a chance of solving other issues without it.

This growth can’t be only in a few favored neighborhoods like Downtown and Hollywood. We need new housing everywhere – the Valley, the Westside, South Bay, southeastern LA County, Orange County, the San Gabriel Valley – everywhere.

‘Round Palms – Hannum Drive

Way overdue for another look at land development patterns in Palms. As we’ve seen before, Palms isn’t just dingbats – there’s a healthy proportion of newer buildings along with some original single-family houses. Busier streets like Motor, Clarington, and Palms Boulevard itself have transitioned to apartment houses almost entirely. However, today’s tour takes us down Hannum Drive, a quiet side street that runs for just one block between Hughes and Feris, and still has a cluster of SFRs.

Hannum starts at Hughes, across the street from this construction site, which was SFRs as recently as last fall, when I did my tour of Hughes.

01-HughesConstr

The south side of Hannum starts out in typical Palms style, with two small 6-unit apartment buildings (1963 on the right, 1973 on the left).

02-SouthApts

Same story on the north side, with three small apartment buildings (a 1954 6-unit building just out of frame to the left, a 1963 fourplex, and a 5-unit building of unknown).

03-NorthApts

And then, just like that, you’re in SFR heaven the rest of the way to Faris. Here’s the south side, with a string of seven SFRs all dating to 1925-1926.

04-SouthHouses

The blue one even has a sizable yard made out of a vacant lot (I’m inferring same ownership by same last date sold).

05-SouthVacant

The north side has five SFRs in a row, all dating to 1925.

06-NorthHouses

Here’s another shot of the north side. The apartments in the background are on Faris and date to the 1980s.

07-NorthHouses2

South side. Cute!

08-SouthHouses2

A parting shot back up towards Hughes

09-Parting

Now, you might wonder if this little cluster of SFRs is protected by R1 zoning. Nope, it’s all R3.

ZIMAS-Hannum

This is how neighborhoods grow when you let them. This group of single-family homes is thriving, despite over six decades of apartment construction in Palms. No one is being forced to give up their home. There’s no “incompatible” development – new apartment buildings pop up every now and then, and everything works fine together.

This is also how neighborhoods grow when you don’t abuse eminent domain to assemble full blocks of property for redevelopment. Go back to the top and check out the new apartment building under construction on Hughes. It abuts a solitary SFR. You think the apartment developers didn’t try to buy that lot too? They probably did, but the SFR owners decided they didn’t want to sell. The result is that sometimes a new building is put up on several parcels assembled together, sometimes on two parcels, and sometimes just a single parcel, like a classic dingbat. This produces a variety of building sizes, structure heights, street frontages, and architecture that you just don’t get when you redevelop an entire block. Nobody would ever plan to put one SFR by itself on Hughes; it just happened.

Next time you’re around Palms, pay attention to this. It’s a great, positive example of how single-family houses and apartment buildings of different sizes and ages can coexist – the perfect antidote to whatever you’re hearing from your local NIMBYs.

How to Write Your Very Own Pro-Sprawl Trend Piece

If you’re sitting around reading pro-sprawl opinion pieces by the likes of Wendell Cox and Joel Kotkin thinking, “sounds good, how can I get in on this action”, not to worry. There’s a simple template to follow, as demonstrated yesterday by an article in that venerable institution of urban research, Politico. This one was written by Robert Bruegmann, but it doesn’t really matter. Like 80s hair band power ballads, if you’ve heard one, you’ve heard them all.

Anyway, here we go. Items to include:

Generic comparison of cities that, in real life, have remarkably different urban forms: “Atlanta has wrested away from Los Angeles the distinction of serving as the poster child for sprawl.” Bonus points if you use two cities that I chose to demonstrate different types of suburbia.

Everything since 2007? Ignore ignore ignore: “Atlanta, over the last half century, has obviously seen its population and its economy grow faster than most of the older, higher-density, more transit-oriented cities of the United States or Europe.”

Talk about congestion but never mention VMT or transportation energy use per capita: “the greatest congestion and longest commuting times in this country. . . tend to occur in the largest and densest urban areas.”

Assert that transit doesn’t help the poor: “a major expansion of the transit system wouldn’t even benefit most people who can’t drive because the jobs are already so scattered around the metropolitan area, and the poorest people can’t afford the fares.” Oh, you can’t afford a car either? Welp.

Imply or state that expensive cities all have the same land use policies: “it is certainly not true of many of the highest-density places in North America – urban areas such as San Francisco, Vancouver, Toronto or even Los Angeles—where public policies aimed at curbing sprawl have led to sharply higher housing prices.” In fact, these four places have important differences in land use policy. Vancouver and Toronto are building new towers like crazy, and, especially in the case of Toronto, are cheaper than SF or LA. Vancouver, Toronto, and SF all have significant controls on suburban growth at the fringe, but in LA, you can build all the sprawl you want in the Antelope Valley, the Victor Valley, and Riverside County. I’m still waiting for someone to show me the policies in LA that are “aimed at curbing sprawl” other than maybe these things. Show me! SHOW ME!

Equate today’s dense first world cities with Third World slums and old law tenements: “every poor urban area in the world continues to have very high densities by historic standards, usually more than 50,000 people per square mile. On the other hand, every affluent urban area in the world. . . where urban densities often topped 100,000 people per square mile in 1900, in the Atlanta today the figure currently stands at an exceptionally low 1,800 people per square mile.”
Decry anti-sprawl efforts as unnecessary interference in free markets, while ignoring the reams and reams of regulation that enforce suburban development patterns: “as people have become richer they have demanded more space, and they have gotten it everywhere there has been a truly democratic government and anything resembling a free market in land.”

Studiously avoid mention of any other “historical background” that might explain why US cities started decentralizing in 1950 and why Southern cities in particular are very spread out: “this historical background helps explain why Atlanta, as a city in the affluent world that has done most of its major expansion fairly recently, is such a sprawling place.” You don’t need me to spell this one out for you, right? Wink, wink.

Notably on-point critique of a lot of anti-sprawl activism: “it has been a conspicuous fact of urban life that many of the same people who deplore sprawl at the edge are also determined to preserve the character of their existing neighborhoods in the center.” Credit where credit is due, right? We’re looking at you, Westside, Marin County, San Francisco, and Peninsula.

Ignore international examples like Japan when they might be inconvenient for your narrative: “strident efforts to reverse the course of urban history and push these places back into the mold of dense 19th-century cities heavily dependent on public transportation risk destroying the very things that have made them such magnets for population and economic growth in the first place.”

Easy, right? Crank out a few of these and see if you can’t get a job at Reason or Cato.

To be honest, I wish the criticism of anti-sprawl activism and smart growth was, well, smarter. If you read O’Toole, Kotkin, and Cox regularly, you’ll find that they do make good points. But you have to sort through a lot of junk to find them. In a way, the criticisms of dense development are a lot like the “pop urbanist” analysis of cities – unwilling to understand and think about each city on its own terms. One side will tell you that you need more freeways and subdivisions. The other side will tell you that you need streetcars and high-rise development to attract the creative class or Millennials or whatever we’re calling young people with money now. If they say anything helpful, it’s almost coincidental.

Cities are complex. To have any chance of understanding them, we have to be willing to set aside any worries about what a city should look like, and study how they work (or don’t work). And we should be willing to learn from anywhere, but also willing to accept some lessons may not apply. Assuming that all cities have the same problems which have the same solutions is bound to result in recommendations that are embarrassing – or at least should be.

LA Land Use Patterns Help Reduce VMT

Sometimes you find things in the darnedest places. While reading Randal O’Toole’s testimony on Washington’s Growth Management Act (spoiler: he’s opposed), I see he references work by David Brownstone down at UC Irvine:

As University of California (Irvine) economist David Brownstone concluded after thoroughly studying this issue, the link between land uses and driving is ‘too small to be useful’ in attempting to save energy or reduce emissions.

Hmm, as someone they tell me was a Great Communicator used to say: trust, but verify. So let’s see what Brownstone has to say in his most recent paper:

The estimation results indicate that residential density has a statistically significant but economically modest influence on vehicle usage, which is similar to that in previous studies. However, the joint effect of the contextual density measure (density in the context of its surrounding area) and residential density on vehicle usage is quantitatively larger than the sole effect of residential density. Moving a household from a suburban to an urban area reduces household annual mileage by 18%.

I’ll leave you to speculate as to why O’Toole would cite authoritative sounding sources that, on closer review, clearly do not say what he would like you to think.

Nevertheless, the result of the Brownstone paper is very important: density on the census block level has a relatively small impact on vehicle miles traveled (VMT). Regional effects dominate. In other words, density is much more important on the regional scale than the local scale. If you want to decrease VMT, you need to increase regional density, not just build TOD projects at transit stations.

This study lends support to things we’ve explored from an intuitive perspective before (and data is almost always better than intuition). It explains how places like LA and Orange County can show up in lists of lowest household gasoline use* – even if you have to drive, you never have to drive very far. And it also shows a possible way forward for a region that shows up on lists of highest household gasoline use – the IE. Rather than focus on building TOD projects near transit stations, officials in the IE should upzone everywhere. They should allow things like Palms-style apartments and redevelopment of Cudahy-style lots the way they’ve been redeveloped in their namesake city. Because while the IE will probably never be able to emulate New York City’s travel patterns, it could certainly emulate LA’s.

*Note: 7 of the 10 worst gas guzzling cities are in the South (excluding Texas), which also makes sense in the context of my post on suburb types.