Monthly Archives: April 2015

Baja California State Water Project

As California grinds through year 4 of a terrible drought, it’s become clear that the state needs to overhaul its water management practices. However, the need to reform how manage the demand side shouldn’t turn us off to augmenting things on the supply side. Climate change and a growing economy have reduced the margin for error, and supplies are nearly maxed out. So here’s an exploration of an off-beat idea to increase water supplies for California and the Southwest in general.

Desalinization has long been a sort of Holy Grail of water supply in California; every day, the sapphire Pacific taunts us with its endless supply of unusable water. Desalinization technology has been improving, and costs decreasing, but the process unavoidably produces large quantities of concentrated brine as a waste byproduct. This highly saline water can have a negative impact on ocean ecosystems without careful management.

Enter Baja California. Just south across the border from the sweltering farms of the Imperial Valley, west across a low mountain range, lies an enormous salt flat know as Laguna Salada. This large, closed drainage basin, created by the same tectonic forces that created Death Valley and Nevada’s endless basin and range, is located about 60 miles northwest of the Gulf of California. Like Death Valley and the Salton Sea, this basin has been dropped below sea level, which means the energy needed to get sea water there is pretty low. It’s also a blazing hot desert, with enormous evaporative potential: over 4 feet per year from a free water surface.

The centerpiece of this plan would put huge desalinization facilities at the north end of the Gulf of California, powered by solar energy farms. Rather than cause environmental issues by being discharged into the ocean, the concentrated brine would flow north to Laguna Salada, where it would simply evaporate. The sea salt precipitating out of the brine would be harvested for sale. With the intense Baja California sun, and assuming a 50% recovery ratio, each square mile of the Laguna Salada would yield 2,560 acre-feet of drinkable water per year. Inundating the 300 square miles of the Laguna Salada would yield over 750,000 acre-feet of water per year.

As the title of the post suggests, this project would be built by the state of Baja California. The admittedly complex scheme would work as follows. Baja California would produce fresh water, which it would sell to water users in the southwest with the most junior water rights: the states of Nevada and Arizona, and the CA State Water Project (SWP).

Since there is no way to convey water from Laguna Salada to Arizona and Nevada, project water would be swapped with Colorado River water via the Imperial Irrigation District (IID) and users in Mexico. Nevada and Arizona would get additional water from the Colorado in exchange for IID and Mexican users getting water from the project. This swap actually has a side benefit in that it would mix demineralized water from the project with the excessively mineral waters from the Colorado River, alleviating salt build up in IID and Mexican fields. In wet years, NV and AZ transfers would be represented by additional storage in Lakes Mead and Powell.

Meanwhile, water from the project could also serve the Coachella Valley, which extends from Palm Springs to Indio. Coachella users would swap project water for water from the Southern California Metropolitan Water District, which would in turn swap water with SWP users. In wet years, SWP transfers would be represented by additional storage, in this case recharging groundwater supplies in the San Joaquin Valley.

Some notes on the scale of facilities. The largest desalinization plant in the world is Sorek, in Israel, produces 150 million cubic meters of water per year, equal to about 120,000 acre-feet. Thus, the project would require 6-7 facilities the size of Sorek, which seems reasonable. Salt content in the Pacific Ocean is about 35 g/L, so completely evaporating 1.5 million acre-feet of sea water per year would yield over 50 million tons of salt. If that sounds like a crapload of salt, it is – it’s equivalent to at least 15% of global production.

If harvesting the sale doesn’t work, or if you wanted to expand the scale of the project, you’d have to return the brine to the ocean. However, that might impact the Gulf of California’s unusual thermohaline circulation (salty water out on top), which contributes to biodiversity in the gulf. Even with large desalinization facilities, it’s a very small amount of brine relative to the volume of the gulf – I just have no idea what the impacts would be.

This scheme is obviously pretty half-baked, and not without impacts, such as impacts from running such an enormous salt farm. Consider it a jumping off point for creative ideas to augmenting California’s water supply. The drought is pushing us, but human ingenuity can overcome it, both with ways to provide more water as well as ways to conserve and wisely use what we have.

LACMTA Bus Ridership – San Fernando Valley Edition – February 2015

We’ve been looking at LA Metro rail ridership and Westside bus ridership for a while; now, let’s expand our coverage to look at some of the main routes in the San Fernando Valley. For north-south corridors, we’ll take San Fernando, Van Nuys, Sepulveda, and Reseda; for east-west, Ventura, Sherman, Roscoe, and Nordhoff.

The Valley is frequently thought of as suburban, but like much of LA, “suburban” includes some major business nodes (Warner Center, Sherman Oaks, Universal City, & Burbank). There are urban residential densities of over 25,000 per square mile in the apartment neighborhoods like Van Nuys, North Hollywood, and Panorama City, the latter of which has several census blocks with densities over 50,000 per square mile. Like the Westside, the expansion of apartments & condos in the Valley is almost totally stymied by zoning constraints. The selected corridors exclusively serve the Valley, with the exception of Sepulveda (connecting to the Westside) and San Fernando (connecting to downtown LA).

Because some of the Metro bus routes serving the Valley operate on more than one of these corridors, there’s a little bit more sausage-making involved in generating the ridership numbers. Route 150, operating on Ventura, branched onto Reseda in the west Valley; the Reseda portion has been rebranded as Route 240 but ridership data is only reported for Route 150. The routes on Van Nuys Blvd, 233 and 761, formerly continued south through Sepulveda Pass to Westwood; however, that function was recently reassigned to the Sepulveda routes, 234 and 734. At the same time, Route 761 was combined with the Reseda Rapid, Route 741, to form Route 744, a U-shaped route following Reseda, Ventura, and Van Nuys. Ridership has been apportioned from routes to corridors based on boardings at each stop, as provided by commenter Calwatch on previous posts. Ridership through Sepulveda Pass is assigned to the Sepulveda Corridor. Almost all Route 233 ridership remains assigned to Van Nuys, but just over 25% of former Route 761 is assigned to Sepulveda.

Here’s the raw data. As always, highlighted cells represent top 10 ridership months since January 2009. All routes put up their best months in the 2009-2010 period; this may be due to the recession reducing car ownership.

valley-raw-20150418

Here are the 12-month rolling averages for weekdays. Van Nuys stands out as the clear winner among Valley bus routes. Van Nuys checks in with ridership in the low 20,000s, not much below the Orange Line’s ridership in the high 20,000s. One might wonder how ordinary bus routes on Van Nuys could have nearly as much ridership as the Orange Line BRT, which is supposedly near capacity; the answer, of course, is that the Orange Line isn’t anywhere near capacity.

valley-Wk-20150418

While these numbers aren’t shabby, they’re nowhere the Westside routes we looked at, with Wilshire, Vermont, Western, and Santa Monica well exceeding Van Nuys. After Van Nuys, most routes cluster together in the 10,000-15,000 boardings per day range, reflecting the distributed nature of density in the Valley. Reseda and Nordhoff are the lowest, likely because the west Valley and north Valley have lower densities and these routes are the furthest west and furthest north of those examined. These routes offer untapped possibility, though – Cal State Northridge is located at their intersection, with a student population of over 38,000, comparable to UCLA’s 42,000. UCLA has been able to reduce faculty driving alone mode share to 51% and students to 25% despite not yet having rail service.

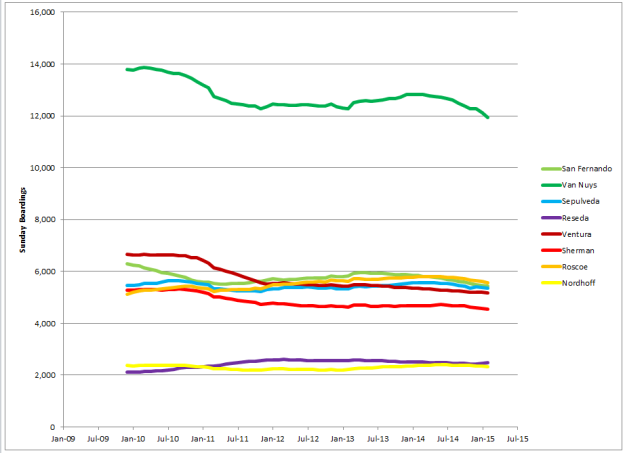
Saturday and Sunday 12-month rolling averages largely reflect weekday trends, as shown below.

valley-Sa-20150418 valley-Su-20150418

Let’s Go Glendale!

Having bid a fond “see ya around” to Palms, we turn our eyes to observing Glendale and getting to know this part of the LA region better. An outcome of LA’s legendary traffic and underpowered transit is that it can be punishing to try to experience parts of the region far from where you live. The Valley isn’t that far from the Westside, but the 405 makes it seem far. That problem certainly applies to travel between Palms (the Westside) and the Burbank-Glendale-Pasadena area, which stands out even among the many difficult trips in the region.

For readers outside Los Angeles and not familiar with its confusing municipal boundaries, we should perhaps first explain where Glendale is located. Glendale is a separate incorporated city, not part of the City of Los Angeles. Downtown Glendale is about 8-9 miles due north of downtown Los Angeles, though the city’s northern reaches extend over 15 miles from downtown LA. Glendale borders the cities of Burbank, Pasadena, and La Canada-Flintridge, along with an unincorporated neighborhood of LA County known as La Crescenta-Montrose. Glendale also shares two borders with the City of LA – Sunland-Tujunga to the northwest, and Atwater Village, Glassell Park, and Eagle Rock to the south. Lastly, Glendale’s northern limits extend up to the Angeles National Forest in the San Gabriel Mountains. The Verdugo Mountains separate downtown and the southern part of the city from the northern part, located in the Crescenta Valley, a narrow valley between the Verdugos and the San Gabriels.

An unconventional way to define Glendale might be as the valley of the Verdugo Wash. This is a short tributary of the LA River that joins the river near where it takes a sharp right turn from running west to east through the SF Valley and heads south to downtown LA. Like the LA River, it is fully contained in a concrete flood control channel. The Verdugo Wash runs east to the north of downtown Glendale, then gradually turns northeast, north, and northwest as it wraps around the mountains of the same name into the Crescenta Valley. Everything south of the 134 – all of downtown Glendale and many residential areas – actually drains away from the Verdugo Wash, but topography makes one suspect that this area is sort of an alluvial fan deposited by the stream. There might be potential for improvements to the Verdugo Wash like those proposed for the LA River.

Freeways

The primary freeways serving Glendale are the 5, the 2, and the 134, which roughly form an upside down triangle around downtown Glendale. Despite serving Glendale, these portions of the 5 and the 2 are almost entirely in Los Angeles. North of the 134, the 2 continues north through the more mountainous portions of the city, ending at the 210, which serves the Crescenta Valley.

Traffic on the 5 is perhaps not quite as bad as the 10 and the 405 on the Westside, but it’s bad enough. Since the 5 runs the full length of the Golden State, it seems to have a larger volume of background traffic, and a notably higher amount of truck traffic – even if your carpool, like mine, leaves at 5 am. Truck traffic is probably increased by the gap in the 710, which eliminates a potential route around downtown LA between the ports and destinations to the north.

The 134, together with the 101 in the Valley and the 210 east of Pasadena, forms a long, continuous east-west freeway stretching from Ventura to San Bernardino, another heavily used corridor in a region with no shortage of well-used freeways. While the 101 and the 134 in the Valley and the 210 east of Pasadena get heavily congested during peak periods, the 134 between Glendale and Pasadena seems to escape the worst traffic. Astute eyes will note that the short Colorado Street freeway, connecting the 5 to San Fernando Rd and Colorado St in Glendale, looks like an abandoned attempt at routing the 134 through the heart of downtown Glendale. In fact, Caltrans’ small white bridge identifying signs still mark these structures as being located on the 134, so there’s potentially a companion post to Walk Eagle Rock’s post on the 134 being rerouted to avoid downtown Eagle Rock. The selected route for the 134 is not only better for downtown Glendale, but much better for a freeway network than the puzzling location of the Colorado St freeway’s end at Griffith Park.

The 2 is perhaps best known for the portion of the freeway that wasn’t built – the portion from the existing end in Echo Park to the west, through Hollywood, Beverly Hills, and Century City to the Westside. This leaves the extant part in Northeast LA and Glendale as one of the more lightly used parts of LA’s network, though congestion on connecting freeways like the 5 can turn parts of it into a giant queue. It’s also the reason it’s hard to get to the Westside from Glendale in the absence of good transit options.

Transit

Ok, enough about freeways, let’s get on to the things that will really interest readers here: transit. At first glance, your LA Metro map makes things look pretty good.

metromap

However, what we have here is a classic case of wide coverage with relatively poor frequency. Here’s a look at some important routes serving Glendale.

metrosched

Routes 90 & 91 serve Glendale Ave, which runs to the east side of downtown and the Crescenta Valley. Route 92 serves Brand Blvd, which is Glendale’s main commercial street. Route 94 & Rapid 794 form a very long route from downtown LA to the independent City of San Fernando, near the northern end of the eponymous Valley. This serves only the western edges of Glendale, but it’s the closest route to me. Finally, Routes 180 & 181, & Rapid 780, serve east-west travel between Pasadena, Glendale, & Hollywood.

Evening and late night headways fall off pretty quickly, making it tough to depend on these routes if you want to do anything other than work your 8 to 5. The two Rapid routes, 780 & 794, don’t run at all late nights or on weekends. Rapid 780 runs with good peak frequencies, and because it’s through-routed as the Rapid for both Routes 180/181 and Route 217 (Fairfax), it sort of functions as the transit route doing what the 2 freeway was supposed to do. (Don’t bother with Route 201, which only runs hourly.) Therefore, when Rapid 780 isn’t running, riders face an additional transfer between Routes 180/191 and Route 217. On top of that; there are the usual reliability issues; on a recent weekday morning my Next Trip app promised 794 service in 42 minutes and 57 minutes. You can sort of see why the BRU complains about this when rail riders get 10-12 minute headways all day, every day.

On the rail side, Metrolink offers a Glendale station at the very southern edge of the city, adjacent to Atwater Village. Frequencies during peak periods are pretty good – there are 30 trains per day – but service ends early, going to hourly or worse at about 6:30pm and ending altogether at 9:30pm. The worst feature of Metrolink is the absurd pricing; a one way ticket from Glendale to Downtown LA is $5.50 to travel a distance of 6 miles, a distance you can double or triple on Metro rail lines for $1.75.

The upside of all of this is that there’s a lot of low-hanging fruit for transit improvements in the area – things that don’t involve, say, building an expensive underperforming light rail line to bridge the gap in the 710 freeway.

As a first take, transit improvements should include improving frequency and spans of service. Options to improve reliability, such as bus lanes and signal priority, should also be explored. On the rail side, Measure R2 plans should explore upgrading these Metrolink Lines to rapid transit frequencies, though that should probably be contingent on upzoning some of the land near the rail corridors.

Development Patterns

Speaking of development, let’s talk a little bit about the built environment in Glendale. As mentioned before, Brand Blvd serves as the heart of downtown, with Glendale’s small skyscraper district (five buildings of 20+ stories, six more of 15-19 stories, almost all outcomes of the late 80s boom) centered on Brand and the 134 freeway. Downtown Glendale has been undergoing a residential and mixed-use mini-boom, with Americana at Brand being the best known development. Since there are many projects in progress or recently completed, it’s probably worth doing two separate posts, one on the commercial projects built in the 1980s and early 1990s, one on the ongoing residential projects. Some people deride Glendale as boring, but having spent a couple evenings on Brand Blvd, I’m willing to say they either don’t know what they’re talking about or are using “boring” as code for “full of retail establishments but not the kind that I like”.

Outside of downtown, there are residential neighborhoods that are actually somewhat similar to, well, to Palms. The residential density of the Census tract I moved to is only a little bit lower than that of the tract I moved from. The biggest difference is that the percentage of single-family residences (SFRs) in my new neighborhood is higher than in Palms, where you might miss the remaining SFRs if you didn’t know where to look. The apartment building stock in Glendale also appears to be newer, with few dingbats and more apartments dating to the 1980s boom, something supported by a casual look at Property Shark. Nevertheless, I’ve done the math, and my apartment building’s 9 units on a 50’x150’ lot are exactly classic R3 dingbat density. When I walk around, though, none of the remaining SFRs are being replaced by apartments, and at first glance the zoning appears to make even existing apartments non-conforming. I’m sure there’s a fascinating story behind that, one we’ll no doubt have to explore in more detail in a future post. . .

Metrolink Ridership Update – April 2015

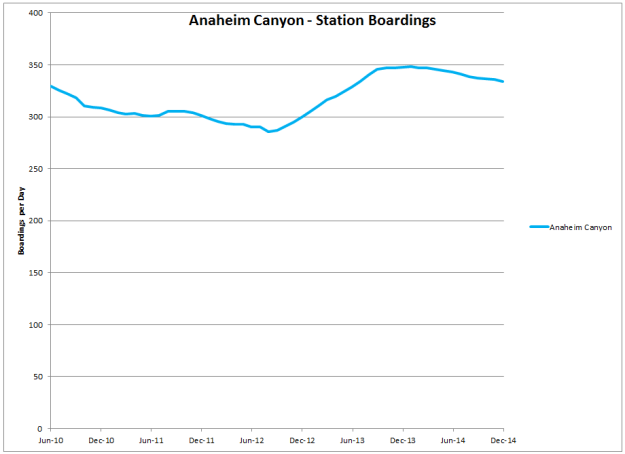
Time for an update on Metrolink ridership, including FY15Q2 (October-December 2014) data. Here’s the breakdown of data by stations.

stations-20150407

As we’ll see, it looks like the downward trend in ridership has finally started to level out. Hopefully this trend continues and ridership starts to pick up, as Metrolink works to address equipment reliability issues. Of course, the impact of new Metrolink CEO Art Leahy’s move to a different floor at One Gateway has yet to play out.

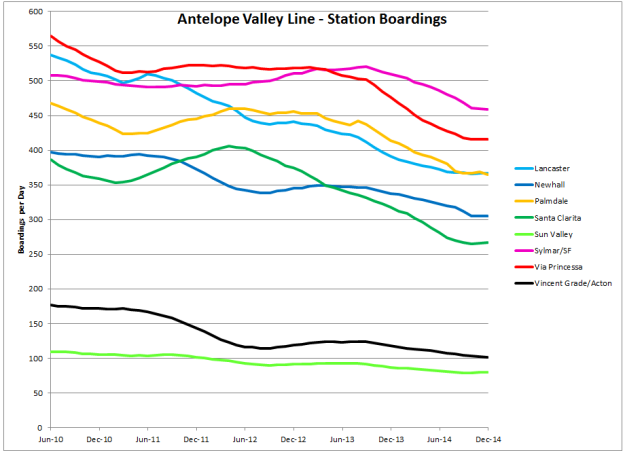
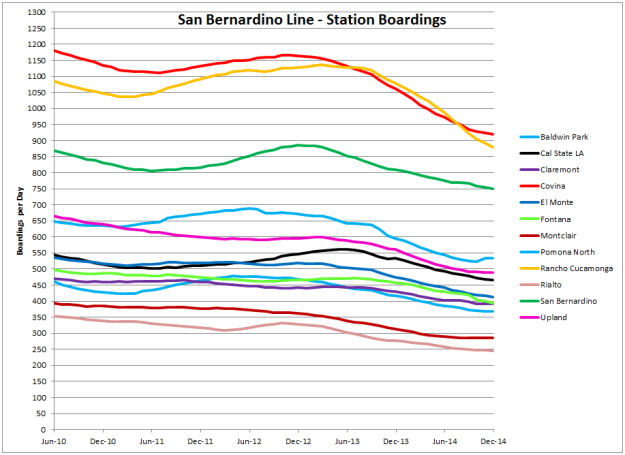
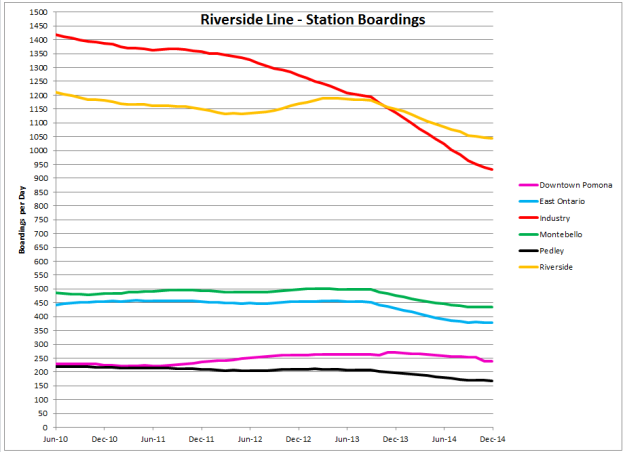
With that, I’ll let the graphics speak for themselves. Here’s the update of the rolling 12-month averages, broken down by line.

Ventura-20150407 AV-20150407 BG-20150407 SB-20150407 Riverside-20150407 91-20150407 OC-20150407 91OC-20150407 AC-20150407

Here’s a look at the top 10 and bottom 10 stations for ridership gained (or lost) over the period from June 2010 to December 2014 (all based on rolling 12-month averages). The top 10 are unchanged, while in the bottom 10, El Monte, Via Princessa, and San Bernardino replaced Montclair, Santa Clarita, and Pomona North.

abstop-20150407 absbottom-20150407

A Farewell to Palms

A Farewell to Palms

For those who missed it on Twitter, home base for this blog recently relocated from Palms to Glendale. While I’m excited to get to know another part of the LA region much more closely, I won’t lie: I’m really going to miss Palms.

Palms is one of LA’s most low-key neighborhoods. Instead of calling to mind stereotypes, like places as varied as Beverly Hills, Compton, Venice, and Silver Lake do, mentioning Palms is likely to elicit a puzzled expression, even from longer-term LA residents. We’d occasionally joke that when you say you live in Palms, people would think of Palm Springs or Palmdale.

In a way, flying under the radar is one of the greatest strengths of Palms. Rather than getting downzoned in the firestorm of NIMBYism that exploded over so much of the Westside in the early 1970s, Palms remained zoned R3 and R4. This has led to a natural, gradual evolution of the neighborhood’s housing stock, with single-family residences (SFRs) being replaced by dingbats in the 1960s, early-style podiums in the 1980s, and modern podiums in the 2000s to the present. This pattern of development is unavailable today in many LA neighborhoods, because after decades of zoning restraints, land prices are too high for the first stages to pencil out.

Meanwhile, the commercial boulevards of Palms – Motor and Overland Avenues – have grown into a wonderfully chaotic mix of apartments, retail, industry, and even a few holdout SFRs. You might even call this the “C2 development pattern”, which emerges all over LA in C2 zones. You really can’t plan that diversity of use at such detail; you have to enable it and let it happen.

It’s no coincidence that Palms became one of the most affordable areas on the Westside, and one of the most diverse neighborhoods in LA. Palms isn’t a destination; it’s just an ordinary dense urban neighborhood that gets the job done for its residents – a vale of humility among hills of conceit. It’s the kind of place that politicians and planners should facilitate more development of, rather than trying to create headline destination districts.

Change is never easy. With growth strangled across most Westside neighborhoods, Palms is one of the few outlets for the market to provide new housing supply to meet surging demand. Inevitably, that has meant that newer projects in Palms have a more upscale flair, and rents for existing buildings have been creeping up. The g-word has been thrown around, though I wouldn’t call it that, since Palms has been undergoing continual redevelopment and change for decades.

Sometimes, you change neighborhoods. And sometimes, neighborhood change comes to you. I’m fortunate enough for it to be the former, and for change to be an opportunity. Palms has been, and will continue to be, an important part of this blog. But be prepared for some in depth posts on Glendale. Change isn’t easy, but it’s often necessary for us to evolve and grow, precisely because we’re not quite sure where it will lead. Let’s go, Glendale!

Dam the Golden Gate

With California facing a severe drought today, negative impacts from climate change long term, and exorbitantly expensive housing, it’s time to think big about solutions to address our water, energy, and housing shortages. Fortunately, there is an easy mega-project that can help us tackle all three: dam the Golden Gate.

Under this proposal, a large concrete arch dam would be constructed across the Golden Gate, just west of the bridge. Since the inflow of the Sacramento and San Joaquin Rivers would not be sufficient to maintain the water level of the closed-off bay at sea level, water levels would start to drop due to evaporation. The difference in elevation between the ocean and the closed-off bay could then be exploited to create an enormous hydroelectric generation facility at the Golden Gate.

Since the Golden Gate Dam would inevitably doom salmon and smelt in the delta, there would be no need to allow any fresh water to enter the bay. Therefore, the entire flow of the Sacramento and San Joaquin Rivers could be diverted south to Central Valley farms and Southern California via the State Water Project. An auxiliary dam across the Carquinez Strait would allow Suisun Bay to be converted into a freshwater reservoir to increase water storage for droughts.

This plan would increase the dependence of Southern California on water supplies from Northern California; however, by putting the Port of Oakland out of business, it would increase the dependence of Northern California on imports made through the Ports of LA and Long Beach.

Finally, by lowering the level of San Francisco Bay, the plan would create hundreds of thousands, if not millions, of acres of new land. All this land would be developed with single-family tract housing, which, ya know, is the only kind of housing we want to allow to be built in California anyway. While some might initially object to the impact on the natural environment, these works would no doubt become revered achievements, making good use of nature’s error.