Monthly Archives: May 2015

The Minimum Wage & Housing Prices

Thanks to @devin_mb for helpful input on this post.

The Los Angeles City Council recently voted to increase the city’s minimum wage to $15/hour, a major victory for labor advocacy groups. This is a significant increase over the state minimum wage, which will be $10/hour as of January 1, 2016, and in real buying power peaked at $11.22/hour (in 2015 dollars) in 1968. Overall this is a very good thing for LA’s low income workers. Some have kvetched that other options, such as an expanded Earned Income Tax Credit (EITC) or a Guaranteed Basic Income (GBI), would be better. This is a distraction, because those options only work at the state or even national level, and were not realistically on the table for the city. Like global warming and infrastructure, cities cannot afford to wait while Congress twiddles its thumbs.

In the Twitterverse, or at least the little corner of it focused on housing, there was talk that raising the nominal minimum wage would have no effect on real wages, because California’s ongoing housing crisis will allow landlords to capture all the wage increase through higher rents. In such a case, raising the minimum wage without taking action on housing is futile.

This is wrong. Landlords cannot arbitrarily raise rents to take away whatever wage increase you receive. Despite all the many distortions, rents are set by the market. If landlords could charge you more for your apartment, they would already be doing it. When the minimum wage increases, landlords will only be able to raise rents if households decide they want to spend their additional income on housing. So, if you get a raise, you might decide to spend some of your money on a more expensive apartment closer to your job, or on a larger apartment. Your desire to increase housing consumption is what allows landlords to raise rents.

However, not everyone is going to receive a wage increase from the minimum wage, and not everyone receiving a wage increase is going to want to spend all of it on housing. Some people who are not receiving a wage increase will respond to rising rents by moving to cheaper areas. It is therefore likely that landlords will be able to raise rents a little, because of low-income households’ increased buying power and supply limitations.

We can make a rough estimate of how much rents will increase based on the proportion of workers receiving a wage increase, the size of the wage increase, and the portion of wages those households are willing to put towards housing costs. Considering current conditions in LA, we will take the last parameter to be 50%. For the current distribution of income among full-time workers in LA, we have the following:

laincomedist

We can see why this minimum wage increase is such a big deal: assuming a uniform distribution of workers in the $25,000-$34,999 bracket, about 37% of workers in LA will get a raise.

Since $15/hr equates to roughly $30,000/year, we’ll assume everyone making less than that gets a bump to $30,000/year. For the $25,000-$34,999 bracket, we’ll assume half of those workers are getting a raise. We’ll also collapse the brackets to single assumed values for ease of analysis: $7,500 for the $1-$9,999 bracket, $12,500 for the $10,000-$14,999 bracket, $20,000 for the $15,000-$24,999 bracket, and $27,500 for the half of the workers in the $25,000-$34,999 bracket that we assume are getting a raise. We can then determine the wage increase for each bracket, as the difference between current wages and $30,000. Next we calculate the resulting rent increase due to each bracket’s wage gains, as (percent of city residents in the bracket) x (wage increase) x (portion of wage increase spent on housing), divided by twelve to convert from years to months.

wagestorents

Summing up each bracket’s rent increase, we see that we expect rents to rise $173/month as a result of the hike in the minimum wage. We can then calculate how much of each bracket’s wage increase is captured by higher rents. Note that if your current wages are already close to the new minimum wage, most of your increase will indeed go to rents. However, the portion falls off quickly for people getting a larger raise; if you make the current minimum wage of $10/hour ($20,000/year), only about 20% of your raise will end up going to higher rents. By calculating the weighted average wage increase, we can find the total amount of increased wages going to rents, estimated to be 19.1%.

Now, a $173/month increase in rent is still a big increase! That’s over $2,000/year, which is a lot of money for people only earning $30,000/year. This emphasizes the importance of solving California’s high housing costs, which we will only do if we address the enormous shortage of supply. However, even if we don’t, increasing the minimum wage will still result in an improvement to the lives of low-income households. It’s just that their lives would be improved even more if we do.

Freeway Ramps and Crosswalks

We haven’t had a freeway post in a long time, but a while back we talked about short-term improvements that can improve the interface between freeways and city streets for pedestrians and bicyclists. The principle goal is to reset drivers’ minds for the urban environment by forcing them to slow down or stop when exiting the freeway, so that they don’t hit city streets at freeway speeds. The best designs for this are the tight diamond and the tight four-ramp partial cloverleaf.

Ideally, we’d like to also strengthen pedestrian connections by providing crosswalks on the city street that would run concurrent with the freeway off-ramp. The city street is often a major arterial road where the crosswalk spacing is too large, and a crosswalk at the ramp would help alleviate that problem.

xwalk-ramp

Here are two locations where such crosswalks were actually installed.

First, the 134 and Glendale Ave:

Second, the 134 and Pacific St:

Nice work, Glendale, on getting those tight diamonds, tight four-ramp partial cloverleaves, and extra crosswalks!

However, freeway ramps are not great locations for crosswalks. At most intersections, the majority of traffic goes straight, with smaller turning volumes, making it feasible to have concurrent pedestrian movements without much danger to pedestrians or impact to traffic capacity. At freeway ramps, though, the situation is reversed. Almost all traffic is turning, so concurrent pedestrian movements create danger to pedestrians and significantly reduce traffic capacity. While pedestrian safety can be improved at such intersections with a leading pedestrian interval, the other problems remain.

Fortunately, there’s a way around this issue that improves pedestrian connections, has a low impact on traffic capacity, and serves the goal of forcing drivers to adjust to city driving conditions. We can simply move the ramp crosswalks away from the freeway, and synchronize the traffic lights so that the crosswalk movement is concurrent with the ramps.

xwalk-midblock

This creates space for the traffic exiting the freeway to queue up. Since drivers exiting the freeway will always encounter a red light at the crosswalk, they will be forced to stop and reset their minds. Pedestrians do not have to contend with conflicting traffic, and the location of the crosswalk might better serve them. A crosswalk adjacent to a freeway will be located such that the freeway is occupying much of the nearby street frontage, whereas a crosswalk further away will serve more development.

If there’s an unsignalled minor street nearby, that’s a natural location for a new traffic signal and the crosswalk. Let’s look at a few examples around the county.

The 134 & Pacific in Glendale:

the134-Pacific

The 10 & Normandie in LA:

the10-Normandie

The 405 & Artesia in Torrance:

the405-Artesia

The 405 & Western in Torrance/LA:

the405-Normandie

These improvements obviously require new traffic signals, which is a considerable expense. Therefore, they should be rolled into either freeway improvement projects or arterial corridor improvements. The pedestrian signal is only a simple two-phase signal, and doesn’t need much intelligence since it will be synchronized with the ramp, which will help some with costs, especially if part of a larger job.

What Would You Pay for Infrastructure?

I generally like the work that Strong Towns does. For example, I agree that cities should focus on getting the basics right, rather than trying to shoot the moon with huge economic development proposals like stadiums, convention centers, corporate tax incentives, and infrastructure projects, unless they have an obvious competitive advantage. As an engineer, I appreciate both Chuck Marohn’s efforts to get engineers to think more broadly about the systems they are part of, and his willingness to comment publicly as an engineer. American politics is much less willing to tolerate public dissent from engineers than from architects and planners.

However, I think some recent commentary on infrastructure financing misses the mark a little. The Density Question asks people to think about how much they would pay for a “once in a generation” charge for all the maintenance and upkeep of the infrastructure they use, based on owning a hypothetical $200,000 house. The post settles on suggesting a property value to infrastructure investment ratio of 20:1 to 40:1, a ratio that is far too high.

The problem is the way the question is being asked. While most people have a good idea of the present value of their house, most people don’t have a good idea of the present value of the property taxes they pay over time. At a 40:1 ratio, a 5% interest rate, and a 50-year infrastructure life span, you’d only be paying about $275/year on a $200,000 property – a tax rate of just 0.14%. A 20:1 ratio would double those values to $550/year and 0.28%. These amounts are well below what people actually pay.

We can’t use California as an example because Prop 13 has made municipal finances hopelessly byzantine, but there is a state with a rational local tax system we can use – Texas. Municipalities in the state of Texas, which famously provides very little state aid to cities, raise $1,872/year per capita. At the average household size of 2.58, that’s $4,830/year. Using the same parameters, the present value of those taxes to be paid over the next 50 years is about $88,000. This is a ratio of 2.3:1, and equates to a property tax rate of 2.42%, which is in line with tax rates in Texas.

Now, this includes things like police, fire, and schools, which may not be in the intent of the Strong Towns post. It also doesn’t account for things like water districts, which often collect their own revenue and function separately from general funds, or gas taxes, which in this analysis should theoretically be distributed proportionately to municipalities. I’m willing to be most people pay more than $550/year for water, sewer, trash, gas taxes, vehicle taxes, and so on.

None of this is to say that many municipalities are not in deep trouble. There are lots of cities that have infrastructure they can’t afford to maintain. Looking at the life-cycle costs of infrastructure, and ensuring that future generations will be able to maintain what we have built, is the right way to do things. However, to do an accurate assessment of that, we need to have an accurate idea of how much people are willing to pay, and that estimate starts with how much they already do. I find it hard to believe that any city would be able to fund its infrastructure costs charging a household only $275/year.

California Housing Crisis Continues

The Census Bureau has released its 2014 estimates for population and housing units at the county level, and the data confirms that Los Angeles, and California in general, are not experiencing a housing boom. In fact, housing construction is still not keeping pace with population growth. We’re still digging the hole, and the deficit of housing units is growing larger.

A simplified way of looking at this is to compare the increase in population to the increase in housing units. If fewer housing units are constructed than should be expected from population growth, our housing situation is getting worse, and unfortunately, that’s what’s happening:

pophousing-SoCal

This table shows population growth and housing growth for 2010 to 2014. In that time period Los Angeles County built 37,437 housing units, but population grew by 298,041, so in effect, we only built 1 housing unit for every 8 new residents. If the ratio of population growth to housing growth (pop/DU) is larger than the average household size, the housing crunch will get worse. Since pop/DU was 8.0 and average household size was 2.85, LA County’s housing crunch worsened.

This trend holds for the Bay Area as well.

pophousing-BayArea

Note that as some observers have suggested, the relative pop/DU ratios for the Bay Area seem to indicate that, while not building enough, San Francisco is doing better than some other nearby counties. (Hi, San Mateo!)

Some commentators, including Aaron M Renn and Chris B Bradford, have questioned the accuracy of the census data on population and housing estimates in recent years, given how large errors in previous estimates. While I don’t know if the census methodology is good or not, we can look at a few metrics to see if the population and housing changes are at least internally reconcilable:

  • Implied Vacancy Change: this is how much dwelling unit vacancy would have to drop to keep household size constant, given housing and population growth. The implied vacancy change for LA County is -1.95%, consistent with what USC’s Casden Multifamily Report says happened between 2010 and 2014. Implied vacancy changes in Orange County and the Inland Empire are also within reason compared to that data.
  • Implied New Household Size: this is how much household size would have to increase to keep vacancy constant, given housing and population growth. Because the existing housing stock is large relative to housing stock growth, the increases are relatively small, so accommodating population growth by increasing household size is also plausible.
  • Implied DU Deficit: this is how much more housing would need to be built to keep both vacancy and household size constant, given housing and population growth. These numbers are within reason relative to the annual housing deficits that the LAO reported in its study on housing affordability, for coastal counties. Inland counties have an implied deficit by this methodology, but they do not per the LAO. This is a sort of sketchy metric because lots of counties, especially inland counties, were still working through the hangover from the housing crash in 2010.

We can also look at a part of California that does not have affordability problems: the Central Valley.

pophousing-CentralValley

Counties are listed from north to south. Counties on the fringe of the Bay Area (Stanislaus and Merced) had very high pop/DU ratios, perhaps because they were working through inventory from the crash. Fresno, Tulare (Visalia), Kings, and Kern (Bakersfield) Counties all had pop/DU ratios below 5.0, consistent with faster housing growth keeping prices down.

Lastly, I compared the Census estimates with the California Department of Finance’s estimates, which ranged from 75% to 125% of the Census Bureau’s value, including very close values for Los Angeles and Orange Counties.

pophousing-CADOF

This doesn’t confirm the census data is right, but it certainly shows that a combination of dropping vacancies and increasing household size could easily accommodate the indicated trends in population and housing stock growth.

California’s housing crisis is continuing, and won’t abate until we start making a serious dent in our shortage of housing supply.

Infrastructure Basics: North American Railroad Signaling

The recent tragic derailment on the Northeast Corridor has raised some interest in railroad signaling systems, so here’s a short introduction to North American practices. If there are any actual signal engineers out there, feel free to correct anything wrong with the logic; however, we are going to simplify the technical side of things to make it easier to read.

Background Principles

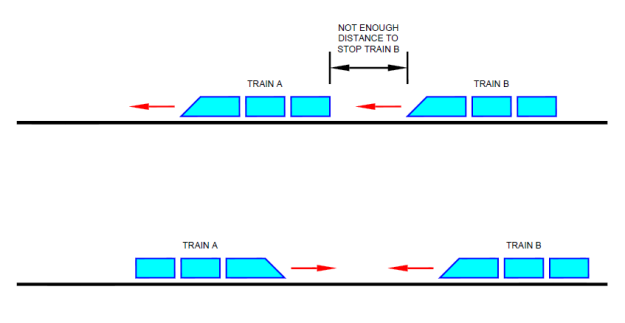
The need for signaling arose from a simple fact: the stopping distance for a train is very large. If you want to get a productive amount of capacity out of your tracks, you can’t depend on a fixed timetable and operation of trains by the driver’s line of sight. Thus, to prevent trains from crashing into each other, you need a way to (a) maintain enough space between trains moving in the same direction on the same track to allow a train to stop safely if something like a derailment happens to the train in front of it, and (b) prevent authorization of conflicting movements, e.g. two trains colliding head-on on a single track or two movements through a set of switches that pass through the same track. Groups of switches controlled by the same signal location are known as interlockings.

01-crashes

Note that enforcement of civil restrictions – that is, speed restrictions resulting from civil engineering features like curves in the track, low-speed bridges, and grade crossings – was not one of the founding motivations for signaling. We’ll return to that later.

Wayside Signals

Signal engineers solved this challenge by dividing the tracks into sections called fixed blocks. Only one train is allowed in a block of track at a time. When a block is occupied by a train, the signal next to the track at the entrance to the block (a “wayside signal”) will be set to red, or “Stop”.

Under the most basic systems, each block of track will be long enough to stop a train from the maximum authorized speed (MAS) allowed on that section of track. The next signal behind the occupied block will be set to yellow, or “Approach”, meaning the train must approach the next signal prepared to stop. Finally, the next signal after that will be set to green, or “Clear”, meaning the train may continue at the MAS. The signal system is also designed so that all of the signals in the opposite direction will be red. The indication displayed by a signal is known as the “aspect”. For the sake of simplicity, we’ll ignore the myriad different types of wayside signals that developed; the principles and information conveyed by the signals are the same.

02-2b3a

Again, note that these signals do not convey information about civil speed restrictions. The MAS depends on civil speeds and may vary quite a bit in curvy areas, but it is not practical to vary the signal design speed (SDS) of the signal system as frequently. Therefore the SDS was often set to be equal to or slightly greater than the largest MAS in the territory. Selecting a higher SDS increases the design stopping distance, providing an additional margin of safety, but reducing capacity.

The basic setup explained above is known as a “two-block, three-aspect” signal system because there are two signal blocks from the occupied block to the clear signal and three possible aspects (stop, approach, clear). This system will get the job done, but it doesn’t make efficient use of available track capacity. A train must stop at a red signal, even though the train occupying that block might be thousands of feet ahead, almost into the next block. (Actually, in between interlockings, a train is allowed to stop at the red signal and then proceed at low speed; this is just a technicality for our discussion.)

03-wasted

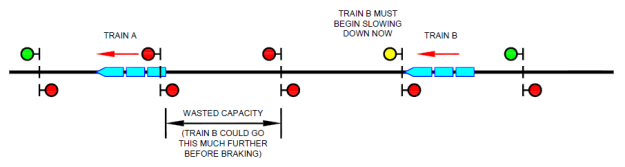
Capacity can be improved by making the signal blocks shorter. For example, by cutting each block in the previous arrangement in half, we can cut the wasted stopping distance in half. Under this arrangement, a train now needs two blocks to stop, so the clear signal must be three blocks back from the occupied block. We also need to add another signal aspect between yellow (Approach) and green (Clear), to tell the train that it needs to stop two signals ahead. This aspect is often called something like “Advanced Approach” or “Approach Medium”, where the latter means approach the next signal at medium speed, usually 30 mph. This setup is known as a “three-block, four-aspect” signal system.

04-3b4a

Rather than adding a fourth color, railroads using color light signals added a second lamp, using combinations of colors to indicate different aspects. Here, for simplicity, we are using green/green for Clear, yellow/green for Approach Medium, yellow/red for Approach, and red/red for Stop.

You could envision chopping the track up into ever-smaller blocks and adding more signal aspects to reduce the wasted capacity. However, that quickly gets expensive, as you have to keep adding more and more signal locations, and there are diminishing returns in terms of capacity for each additional location. Most freight lines are essentially still two-block, three-aspect systems, and most commuter lines are three-block, four-aspect systems at best. Running high-speed trains on the Northeast Corridor required some additional changes, as we’ll see later. We’ll also get to systems that don’t require fixed blocks later as well.

Communicating Between Signal Locations

Displaying the right signal requires you to know what’s going on, in real time, at other locations on the railroad that might be miles away. This was not an easy thing to do in the 1800s. It was solved by an ingenious invention – the track circuit. At one end of the block, the rails are connected to a battery, one rail to the positive terminal and the other to the negative terminal. At the other end, the rails are connected to an electromechanical device called a “relay”. If electricity is flowing from the battery through the rails to the relay, the relay becomes an electromagnet, and the magnet picks up a metal bar connected to a hinge called an armature.

05-relay

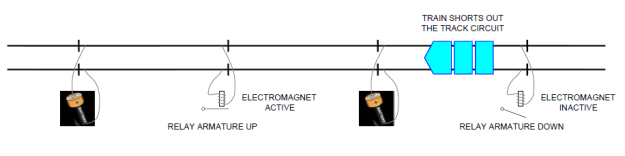
If a train enters the section of track, the train’s axle will short out this circuit. The relay will stop being a magnet, and the metal bar in the relay will drop. This setup has a side benefit in that the relay will also drop if a rail breaks or the track washes away. So, as long as the relay is up, you know the track is there and that there’s no train in that block, so it’s safe to allow a train to enter.

To communicate between signal locations, signal engineers ran line wires between them along the railroad, which is one reason you always see so many utility poles and wires along the tracks in old photos. For a two-block, three-aspect system, the logic for a signal location is simple: if the relay for your track block is down, you display a red signal for your block. If your relay is up, but the next signal block is telling you that its relay is down, you display a yellow signal for your block. If your relay is up and the next signal block is telling you that its relay is also up, you display a green signal for your block. A three-block, four-aspect system operates the same way, just looking one additional block ahead. (We’re ignoring the logic required to decide which way traffic is going.)

06-2b3arelays

Running line wires all over the place along the tracks is costly and they get destroyed by weather over time, so signal engineers eventually devised ways to communicate between locations without using line wires.  The most common way this is done today is through the use of electronic track circuits. With electronic track circuits, the line wires are replaced by the rails themselves. A signal location transmits coded pulses of electricity over the rails to an adjacent signal location, where a computer processor interprets the message, determines what signal aspect to display, and decides what message to send to the next location. For computer-savvy folks out there, these are not messages with many bits of data; they are just a small number of predetermined patterns of electrical pulses. Some railroads have gone with systems capable of more sophisticated communications, such as fiber-optic networks.

Cab Signals

The fatal flaw in these signal systems is that they still depend on the driver to obey the signals. If the driver falls asleep or decides to send a text to someone or is otherwise incapacitated, nothing will stop the train from running a red signal and crashing into another train.

The Pennsylvania Railroad started addressing this problem nearly a century ago with the introduction of cab signals with automatic enforcement. These systems display speed information to the driver in the cab and will take automatic action to stop the train if the driver fails to obey the indicated speed. Information is transmitted between the wayside signal equipment and the train using pulses of electricity in the rails. Equipment on the locomotive detects these pulses and converts it into a speed indication on a screen in the cab.

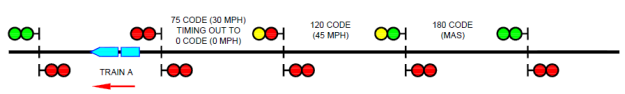
These pulses are even more basic than electronic track circuit communications, and are based simply on a number of pulses per minute. The most common system corresponds to a three-block, four-aspect system deployed all over US commuter railroads, with available pulse rates of 0, 75, 120, and 180 pulses per minute. These correspond to speeds of 0 mph, 30 mph, 45 mph, and MAS, respectively, or to signal aspects of Stop, Approach, Approach Medium, and Clear, respectively. Note that to enforce a stop before a red signal, the 0 mph indication must be given in advance of the signal, in the block where our wayside signal was showing yellow/yellow or Approach. To avoid slowing trains down too much, systems were devised to allow a mid-block change from a 30 mph code to a 0 mph code in the block leading up to the red signal.

07-cab

With few exceptions, such as Metro North, railroads did not take the opportunity to eliminate wayside signals, which had been made redundant, especially between interlockings. This was deemed to be safer and more reliable, because if the cab signals failed, trains could still operate following the wayside signals. However, it increased the amount of equipment that needs to be built and maintained.

Transit systems use similar cab signals, but with different speeds available. For example, PATCO uses 0 mph, 20 mph, 30 mph, 40 mph, and 65 mph, while LACMTA’s light rail uses 0 mph, 15 mph, 25 mph, 35 mph, 45 mph, and 55 mph, plus a yard mode (10 mph) and a street-running mode (35 mph) for places like Highland Park or Washington Boulevard where signals are not enforcing separation of trains.

Amtrak’s Northeast Corridor Cab Signals

With the desire to introduce higher speed trains (Acela) to the Northeast Corridor, it was decided to increase the number of available cab signal indications. This was done to prevent higher speeds from reducing capacity, since higher speeds require longer stopping distances, and provide an 80 mph cab indication that could be used to enforce the safe speed through high-speed switches at interlockings.

This was done by adding one new pulse rate, 270 pulses per minute, corresponding to a 60 mph speed, and redefining 180 pulses per minute to indicate 125 mph. Three other speeds, 80 mph, 100 mph, and 150 mph were added in a somewhat complicated way, described below. (Skip the next paragraph if you’re not interested in the technical details.)

Since the Northeast Corridor is electrified with alternating current at 25 Hz and 60 Hz, and the return current flows through the rails, care must be taken to ensure there is no interference between the traction power system and the signals. Therefore, the cab pulses are modulated with 100 Hz AC, i.e. a 75 pulse code is 75 pulses of 100 Hz AC energy per minute. The 80 mph, 100 mph, and 150 mph cab codes were created by introducing 250 Hz AC energy to the rails during the off phase of the 100 Hz pulses. Thus, the 80 mph indication consists of 120 pulses of 100 Hz and 120 pulses of 250 Hz per minute. 100 mph is 270 and 270, and 150 mph is 180 and 180. Commuter rail equipment that was not upgraded to read both 100 Hz and 250 Hz would see only the 100 Hz energy, and interpret the code as such.

The arrangement for the 80 mph, 100 mph, and 150 mph indications let the commuter rail operators off the hook for upgrading their on-board equipment.  Old equipment would simply read these indications as 45 mph, 60 mph, and 125 mph, respectively, and since they were not going over 125 mph there was no need to read 150 mph. In addition, the 60 mph and 100 mph codes were not deployed until very recently, since older equipment could not read those indications.

ACSES and Civil Speeds

Everything we have discussed so far concerns maintaining safe separation of trains and preventing conflicting train movements from happening at the same time. Traditionally, these systems were not used to enforce civil speed restrictions resulting from curves in the track, slow bridges, and other civil engineering features on freight lines and commuter lines. This function was not seen as the responsibility of the signal system. In addition, many commuter and freight lines have long signal blocks, so restricting the entire block to the speed dictated by short speed restrictions has an impact on capacity and travel times. For example, a 45 mph curve might only be 1,000’ long, but straddle two signal blocks, and therefore might put a 45 mph restriction on two miles of track if the signal system was used to enforce the speed.

Now, even before the advent of computer controlled signal systems, there were workarounds to this issue. You could use a timer relay – a relay designed to drop a specified amount of time after the energy is removed – to change the cab code a certain amount of time after the train enters a block, designed by some smart engineer to minimize the travel time and capacity hit. You could use capacitors to hold up a relay, again for a pre-determined amount of time, which I’ve heard is actually how Metro North used to time out 30 mph cab codes to 0 mph. In practice, I don’t think this was done, both because of the costs and because it wasn’t seen as the responsibility of the signal system.

With the software logic making the decisions nowadays, plus the ease of calculating stopping distances and distances needed to slow down to a target speed, it’s not difficult to use timed cab code changes. In fact, my understanding is that Metro North’s new signal designs will use timed cab code changes for every code in every block, to maximize capacity of a fixed block system.

Note that many transit systems do use cab signals to enforce civil speeds, since they have shorter signal blocks and more consistent types of traffic. Using timers, as described above, to change cab signals in block makes it easy to reduce the impact of signaling the speed restriction.

In the case of the Northeast Corridor, the inability of older equipment to read all of the cab signal indications would make things worse; for example, if you restricted an 80 mph curve using the 80 mph cab indication, older equipment would read it as 45 mph and be slowed down for no reason. Rather than use the cab signal system, it was decided that civil speed restrictions would be enforced for high-speed trains on the Northeast Corridor using a wireless overlay signal system – the Advanced Civil Speed Enforcement System (ACSES).

Permanent speed restrictions are loaded into an on-board computer database and enforced by the on-board equipment as the train moves along the track. The on-board system tracks the train’s location by counting wheel rotations, and correcting at fixed locations known as balises. A balise is like a giant transit fare card mounted between the rails, transmitting information to the train when the train passes over it the same your TAP card transmits information to the fare machine when you tap.

ACSES also allows enforcement of temporary speed restrictions, such as those imposed during construction, and prevents trains from accidentally entering work zones. These functions are accomplished with wireless communications between the train and wayside equipment.

This system was only installed where higher speeds would be achieved: from New Haven, CT to Boston, MA, New Brunswick, NJ to Trenton, NJ, and Wilmington, DE to Perryville, MD. This was likely done to save money.

Since ACSES is an overlay system, there was no need to upgrade commuter rail equipment to be compatible with it, again letting the commuter railroads off the hook for capital improvements. Also note that it again increased the amount of signal equipment that must be installed, increasing capital and maintenance costs. This contrasts with the European equivalent of ACSES, the European Train Control System (ETCS), which is intended to replace the legacy wayside signal systems in use across the continent. ETCS also uses on-board equipment, fixed balises, and wireless communication to monitor and control train movements.

I-ETMS

On the other hand, when the positive train control (PTC) mandate came from Congress in 2008, the vast majority of freight lines did not even have cab signals installed. Their track blocks tend to be miles long, and freight operations depend much more heavily on the driver’s judgement, because there’s huge variability in the type of traffic. A fully loaded coal train has much different braking performance than a rack of empty intermodal cars, and improper application of brakes on a long freight train runs the risk of derailments and separations. Thus, cab signals and ACSES are both expensive and a poor technological fit for the freights.

The major freight lines, and thus everyone else outside the northeast by proxy, settled on a system they call Interoperable Electronic Train Management System (I-ETMS). This was deemed necessary to allow interoperability, as required by the Federal Railroad Administration (FRA), and to facilitate trying to meet the PTC deadline of December 31, 2015.

I-ETMS is a wireless radio-based system that will be overlaid on top of the existing wayside signal systems. On-board equipment will include a database of track geometry and speed restrictions, and monitor the location of trains. The wayside equipment will communicate with the train to indicate upcoming signal aspects and the target stop location, if there is one. The on-board equipment must account for the type of train to determine the proper braking.

CBTC

Communications-based train control (CBTC) uses wireless communication between on-board equipment and wayside equipment to execute all signal functions. In a full CBTC setup, there’s no need for fixed signal blocks, and the wasted capacity is small. The position of all trains and the status of tracks and switches are monitored in real time. The system doesn’t need to start braking a train until the distance to the train in front drops to the safe stopping distance – it’s as if the red signal is always just behind the rear of the train ahead. This is also called a moving block system.

While both ACSES and I-ETMS use wireless communications, they’re not really true CBTC systems, since they’re just overlays on top of fixed block signals. There are very few CBTC systems in operation in North America but there are some, such as the L Line on the New York City subway. CBTC is most beneficial in places where capacity is very tight, such as heavily traveled subways.

Why Not Use ETCS?

The European Train Control System (ETCS) presents an elegant, truly wireless signal system that is not an overlay on top of existing wayside signals. The full implementation, called Level 3, does not use expensive wayside signals, axle counters, or track circuits at all, instead relying solely on balises, on-board equipment, and radio communication. The step below full implementation, called Level 2, still relies on wayside equipment like axle counters or track circuits to determine if fixed blocks are clear. The step below that, Level 1, is an overlay system that can be considered similar in spirit to the other overlay systems discussed here.

My understanding is that at the time the PTC mandate was enacted by Congress, in late 2008, the ETCS standards were still in development and the system had very limited deployment. Given the limited timeframe for installing PTC, it seems reasonable that no one wanted to take a chance on ETCS Level 2. The FRA’s guidance made it clear that it would accept cab signals plus ACSES as a PTC-complaint system; since ACSES was already in use, this strongly influenced the decision of northeastern railroads to choose that solution. Meanwhile, the freight railroads decided to develop I-ETMS based on technology they had already been experimenting with, which again, at least to a layperson, seems reasonable.

The larger question, for which I also don’t have an answer, is why the industry decided to pursue overlay systems, rather than developing stand-alone systems that would allow elimination of expensive wayside equipment. Perhaps the timeframe was judged to be too severe. Perhaps no one wanted to find out what the FRA meant when they said “demonstrated to [reliably execute PTC functions] to the FRA’s satisfaction” for stand-alone systems but only “reliably execute [PTC] functions” for vital overlay systems. The US railroad industry is also extremely conservative in the sense that it does not like changing its practices. We still have wayside signals on some lines nearly a century after the installation of cab signals made them obsolete. This was just as true of the privately run railroads, which maintained those redundant systems for decades before they went bankrupt, as of the successor agencies.

Conclusion

This post really only scratches the surface of train control, but hopefully it provides an easy-to-read overview of the technologies that are out there today. Why signaling improvements have or have not been installed in certain locations, I cannot say, as that has much more to do with public policy decisions and internal agency politics than with engineering.

Dingbat City

Long time readers know that this blog holds the dingbat in high regard, perhaps not for its architectural styling, but as a symbol of a development process that allowed natural evolution of neighborhoods and created tons of instantly affordable housing at a time of rapid growth in LA. Indeed, we’ve gone so far as to suggest that if we want to increase affordability in LA, we need to figure out how to resurrect the spirit of the dingbat.

Dingbats, like any mass-produced building type, have their shortcomings. These are mostly related to use of cheap construction materials for things like windows, poor insulation and soundproofing, and seismic issues stemming from their iconic open carports (which were poorly understood at the time). However, a recent opinion column in the Santa Monica Daily Press tries to conflate these fixable problems with fatal, but fictional, flaws related to density and design, and then conflate dingbats with the five-story podium buildings that, thanks to a recent downzoning, won’t be built on Santa Monica’s commercial boulevards.

After lampooning an architect who improved many people’s lives by making possible for them to move to Los Angeles instead of trying to keep them out, the column reaches the crux of its anti-dingbat argument by asking:

“Don’t most people want. . . elements missing from the dingbats. . . light, openness, blue sky, scale and proportion, privacy, sustainability, and amenities such as courtyards, with trees and landscaping, that enhance one’s quality of life?”

You know what else enhances one’s quality of life? Not having to spend an exorbitant portion of one’s income on housing! Maybe you want trees and landscaping, or the light that so many buildings are said to lack, though I’ve never heard of a dingbat denizen dying from lack of sunlight. On the other hand, maybe you’re working two jobs, or both working and attending school. You need a low-cost apartment, and the “scale and proportion” is the last thing on your mind. Why should a bunch of NIMBYs decide what type of housing you can have? Shouldn’t you get to choose?

In an effort to get you to think that no, you shouldn’t, the column pivots to a discussion of the need to trim one’s wish list when building a dream home, likening it to trimming the development density allowed in Santa Monica’s Land Use and Circulation Element (LUCE). But of course, a downzoning isn’t about NIMBYs trimming their wish lists, it’s about everyone else – young people, low income residents, recent arrivals – making sacrifices for the NIMBYs.

In trying to make that leap from two-story dingbats to five-story podiums, the column falls flat. Modern podium buildings are much better buildings than dingbats thanks to advancements in construction technology, improvements in building codes and design, and the state energy code. Many of the new podium buildings recently constructed in Santa Monica – the kind the column’s author doesn’t want any more of – include the amenities whose absence in dingbats the column bemoans. In fact, the downzonings favored by NIMBYs will help to ensure that many people have no affordable housing option other than the dingbats. It’s kind of strange to slag the dingbats, and then oppose the construction of modern housing too. If you want people to have options other than dingbats, you might want to advocate for those options to be built.

The truth is that NIMBYs don’t really care about building design that much; they just don’t like any density. Likewise, they will pretend to care about affordable housing to the extent needed to align politically with people who oppose development for other reasons, like displacement. For example, a previous column in the Santa Monica Daily Press called for increasing housing affordability by converting office space to residential, a plan that could only have an impact on housing prices if it drove up commercial rents and started forcing small businesses out of Santa Monica. NIMBYs don’t have to care about design or affordability, but they should be called on it when they pretend they do.

As for the stucco box vernacular, you don’t have to love it, but until you have a plan to mass produce higher-quality affordable housing, you should at least respect it.

Moving the Goalposts

Moving the goalposts is a well-known political tactic, where you change your standard of success in response to worse than expected results from your policies (or better than expected results from your opponent’s policies). For example, you might start with the goal of catching a certain criminal dead or alive, but when you fail to do so, restate the scope of the mission to diminish that person’s importance. Or you might keep adjusting the budget and schedule for an infrastructure project so that no matter the cost and completion date, you proclaim it finished on time and on budget.

Opponents of urban development like to do the same thing. For example, considering only the fury rained down on “McMansions” by certain op-ed columnists, you might think the City of LA had been totally unresponsive to homeowner concerns. But in fact, the city already had a “mansionization” ordinance from 2008 and has rushed additional interim measures into place. The noose will be further tightened when final updates are made. However, there should be little doubt that in a few years, the new “mansionization” ordinance will still prove too liberal, and homeowners will be back raging for further controls.

The rationale is similar. If you view politics as a zero-sum game, no amount of success for the opposition is acceptable. Success will be continually redefined until the opposition can be shown to have none. Likewise, there is no amount of redevelopment that many NIMBYs consider acceptable except for none. If a land use regulation makes development more difficult, it will initially be hailed as a success, but if some development continues to occur, the regulation will be deemed to have come up short. The goalposts will have moved.

For another example, in 1986, Prop U downzoned much of LA’s commercially zoned land from FAR 3.0 to FAR 1.5. The lower FAR has proved to be an insurmountable barrier in many areas. However, LA continues to be a desirable place to live, and rising home prices have put development pressure on some commercially and industrially zoned land. Sure enough, some are now proposing to downzone from FAR 1.5 to FAR 0.75. The goalposts move.

If you care about urban economic growth, or affordable housing and gentrification, the best you can ever hope to do by working with these opponents is fight defensive actions. You can slow down their march to zero growth or the loss of affordable housing, but you can’t change the destination. In many cities, opponents of development have organized so powerfully that there is little else the city can do at the moment.

In the long run, you can’t keep giving pieces away to people who will only be satisfied when they have it all. Eventually, you have to stop the goalposts from being moved in a way that works against your interests.