Monthly Archives: February 2016

LACMTA Bus Ridership Update – January 2016 Edition

Six months have passed, so it’s time for another LACMTA bus ridership update. As always, we start with the raw data. Highlighted cells represent the top 10 months for that route (since January 2009).

bus-raw-201601

Here are the weekday, Saturday, and Sunday 12-month rolling averages.

bus-wkdy-12mo-201601bus-Sat-12m-201601bus-Sun-12m-201601

There’s not much new to say, so we’ll keep it short. Most lines continue to decrease. The Silver Line continues to grow slowly. Rolling 12-month average weekday ridership has declined by over 8% on the Orange Line and 10%-15% on the other lines, except the Silver Line which has set new record highs. A glance at the raw data above reveals that these numbers are about to get a lot worse unless something changes soon.

Here’s the percentage of trips on each arterial being served by the rapid route.

bus-share-201601

The share of riders served by the rapid routes continues to slowly rise on most corridors. This doesn’t necessarily mean increasing ridership on the rapid – it could be that both the rapid and local declined, but the rapid was more resilient. For example, here’s the split for Wilshire, where the Westside local (Route 20) has been fairly steady, the Rapid (Route 720) has seen a modest drop, and the heaviest drop has been on the east side local (Route 18).

bus-split-Wilshire-201601

That’s it for now; next up, Valley bus ridership.

LACMTA Rail Ridership Update – January 2016

Six months have passed, so it’s time for another LACMTA rail ridership update. As a reminder, bus ridership for the Westside and San Fernando Valley has been broken out into separate posts.

First, the raw data. Highlighted cells represent the top 10 months for that line (since January 2009).

rawdata-201601

Recent trends have continued, with the Blue, Green, and Red/Purple Lines continuing to decline. On the bright side, the Gold Line is at all-time highs for ridership on weekdays and weekends, setting records at the end of 2015. The Expo Line also had two top-10 months since July; assuming this holds the 12-month rolling average will start to rise soon. The Gold Line will probably be impacted in February by construction-related shutdown, but all of these data points will soon be irrelevant as both lines will have extensions come on line.

Here’s the rolling 12-month average of weekday ridership:

wkdy-12mo-201601

As noted previously, some of the drop in the Blue and Red/Purple Lines may be due to ongoing construction that has increased late-night headways and shut down portions of the Blue Line at times.

Saturday and Sunday trends largely reflect the weekdays.

Here’s the Saturday and Sunday rolling 12-month averages.

Sa-12mo-201601Su-12mo-201601

And lastly, here’s the update for the rolling 12-month average of boardings per mile:

wkdy-bprm-201601

The Expo Line has very nearly passed the Blue Line for boardings per mile, but not for the reasons we’d hope! It seems likely that the Expo Line will race past the Blue Line once Expo 2 opens to be the most productive light rail line.

Our next update will be in July 2016, so hold on to your hats for two LRT extensions!

Metrolink Ridership Update – December 2015 Edition

Time for an update on Metrolink ridership, up through FY16Q2 (October – December 2015) data. Here’s the breakdown of data by stations.

stations-20160206

Last time, we mentioned that it looked like the declines in ridership had started to level out, and hoped that new Metrolink CEO Art Leahy would be able to get those numbers moving in the right direction. Ridership has started to creep back up at many stations, but the effect of the $2 station-to-station fare on the Antelope Valley Line is undeniable. It still has a long way to go just to get back to where it was, but it’s better than further declines.

With that, I’ll let the graphics speak for themselves. Here’s the update of the rolling 12-month averages, broken down by line.

Ventura-20160206AV-20160206BG-20160206SB-20160206Riverside-2016020691-20160206OC-2016020691OC-20160206AC-20160206

Here’s a look at the top 10 and bottom 10 stations for ridership gained (or lost) over the period from June 2010 to December 2015 (all based on rolling 12-month averages).

abstop-20160206absbottom-20160206

Is LA’s Economy Adapting Poorly to Global Change?

Over the last few years, there has been much consternation – much of it fair, in my opinion – about the performance of the LA region’s economy over the last few decades. More dubious are the opinion pieces that look to tie this underperformance to some singular regional problem or disamenity. Since the Bay Area economy has been blazing hot, it is natural that many comparisons between SF and LA have been made.

Let’s go beyond the anecdotal level and take a closer look. Much analysis starts in 1990, perhaps because that’s the oldest data for regional (MSA) level employment information easily available from FRED. I’m adding the New York City MSA to the graphs as a reference for another large established region. (If you add a place like Houston, it’ll just blow everyone else out of the water.)

01-4reg-1990

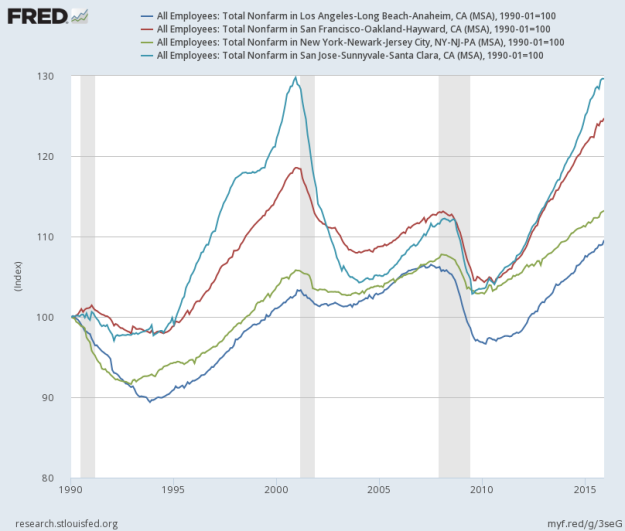
Indexed to 1990, LA has indeed done considerably worse than SF, San Jose, and NYC. However, astute observers will note that a lot of this is because LA did much worse in the early 1990s. The recession of the early 1990s did not affect all parts of the country equally; while SF and SJ more or less moved sideways, NYC and LA were really punished. In particular, LA’s defense industry was gutted by cutbacks in defense spending at the end of the Cold War. Should LA’s leaders be held accountable for the collapse of the Soviet Union? Probably not. A more reasonable comparison might therefore start at the bottom of employment in the early 1990s, in November 1993.

02-4reg-1993

This simple change to the baseline date just about eliminates the argument that the Bay Area has trounced LA over the last two decades. SF and SJ race ahead with the tech boom in the 1990s, LA and NYC outperform them during the 2000s, and then SF and SJ race ahead again with the latest tech boom. The fact that LA’s economy got crushed in the early 1990s and SJ’s economy got crushed in the early 2000s is really just about regional differences in the importance of the sector that got hit the worst.

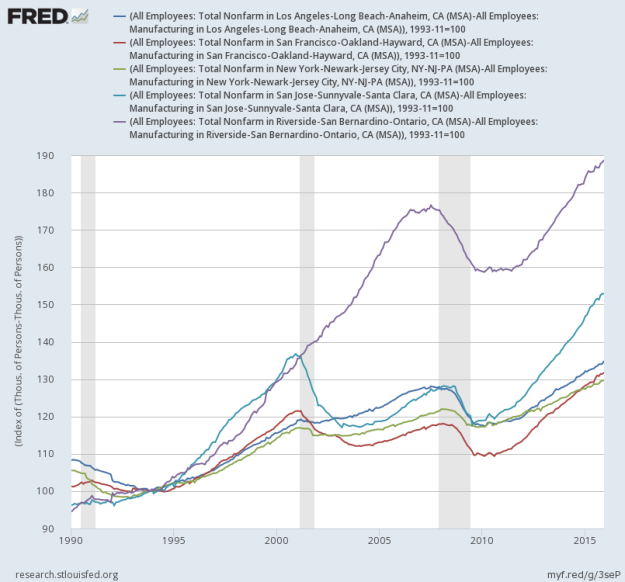
Speaking of regional differences, many comparisons ignore that LA was much more dependent on manufacturing employment in 1990 than the Bay Area and some other large cities in the US. There has been a secular decline in manufacturing employment across the US. Again, should LA’s leaders be held accountable for the fact that they had a huge legacy manufacturing sector in 1990? Probably not. An even more reasonable comparison might therefore exclude manufacturing employment.

Here’s regional employment ex manufacturing, indexed to November 1993.

03-4reg-1993-exmfr

In this case, LA performs a little better than SF and NYC, while SJ (which had a large tech-based manufacturing sector that got destroyed in the early 2000s) is the clear winner.

You might find it interesting that San Jose, a more outlying part of the Bay Area, performed much better than San Francisco, at its heart. And you might also think, hey, isn’t there a more outlying part of Southern California that we could also throw into the mix? And you’d be right: we could add the Inland Empire, the Riverside-San Bernardino MSA.

Here’s regional employment, indexed to November 1993, adding the IE.

05-5reg-1993

Here’s regional employment ex manufacturing, indexed to November 1993, adding the IE.

06-5reg-1993-exmfr

Obviously, the IE is the part of California that really has things figured out, and both SF and LA should try to be more like the IE, right?

Lastly, let’s take the combined regions SF-SJ and LA-IE. Here are the same two graphs, showing SF and SJ combined and LA and the IE combined.

08-3reg-1993

09-3reg-1993-exmfr

SF-SJ performed a little better in the 1990s and 2010s, but overall LA-IE has done better than SF-SJ or NYC, even ignoring the impact of manufacturing employment.

Stepping back from the data, I’m not sure what to make of some of the critiques of the LA economy. Yes, many of the jobs created by investment and modernization of the ports are low wage jobs, as are the logistics jobs booming in the IE. But given the changes in global trade, all of that cargo has to come into the US somewhere. Is it such a terrible thing that it comes to LA-IE, the second largest US market, and created a ton of blue-collar jobs? Factory jobs weren’t higher-paying because factories are magic, they were higher-paying because of unions. The wages and lives of LA’s huge population of service industry workers will be greatly improved by labor organization for higher pay, which is already happening.

Likewise, the emergence of SF-SJ as the world’s tech capital instead of LA is to a large extent a random event. Do you really want to say you know why it happened at Stanford and Berkeley, not UCLA and USC, or Harvard and MIT, or even UT-Austin or Carnegie-Mellon? Really? The confluence of events that have to occur in the creation of an economic geography like Silicon Valley (or Hollywood or London) includes so many random outcomes, you can hardly credit one region’s leaders for becoming an industry hub or fault another region’s leaders for not doing so. Apple Computers survived, Wang Computers did not, and it didn’t have a damn thing to do with city governance in Cupertino or Lowell.

Furthermore, only a few cities will get to be dominant in any particular industry. SF-SJ and a few other cities can be heavily concentrated in tech, but everyone can’t be. Many other cities can have thriving, but small, tech sectors. All cities will have a small banking sector; very few will be New York or London or Tokyo. If LA had emerged as a tech capital and the Bay Area had been left behind, would California as a whole be better off?

It can be very hard to disrupt economic geographies once they’re established. At this point, New York and London are capitals of the finance industry simply because they’ve always been capitals of the finance industry. Hollywood is Hollywood because it’s been Hollywood for a century. It’s not that you can’t make a successful movie somewhere else, but the labor skills and institutional know-how already available in LA make it a natural fit for people who want to do that.

It’s not hard to believe that at this point, the Bay Area is the tech capital just because it is. In a positive feedback loop, people go there for the tech industry because that’s where the industry is and the industry goes there because that’s where the people are. If he did anything, Benedict Evans laid to rest the idea that all the techies are drawn to San Francisco by something else.

It’s also not hard to believe that, if another tech crash comes, many of the people now singing the Bay Area’s praises will point out that the region was dangerously concentrated in software development. Look back at those charts: no region soared as high or crashed as quickly as Silicon Valley. But if it’s unclear what LA’s leaders should have done to develop a larger tech sector, it’s equally unclear what the Bay Area’s leaders should be doing to cool the tech boom and diversify the economy. Economic geographies are complex, and ultimately, no one really knows what caused a particular sector in a particular region to grow or not grow.

None of this is to say that there aren’t things to worry about in the LA economy. Wage growth for low-income households has been dismal, and the IE in particular has seen very low wage growth. The high cost of housing makes the region less competitive and makes it harder to start a business or attract workers.

Not coincidentally, all of this strongly supports upzoning. Since we don’t really know how to make a particular sector in a particular region grow, it’s all the more important to let people take advantage of economic opportunity where it exists. That doesn’t mean that there won’t be successful enterprises in many different sectors in many different cities; it just means that to give the most people the best chance to improve their lives, we should allow them to live and start businesses in all of the places where economic opportunity exists.

Walkabout: Yongmasan, Seoul

Well, it’s about time for another walk through a random part of a city, right? The ground rules were laid out here. Last time found us in suburban Murray, UT. Today we’re in a very different place: Yongmasan, a station on the 7 line subway in Seoul. With a free day in Seoul, I picked it out randomly – well, sort of: literally translated, Yongmasan means “dragon horse mountain,” which sounded kind of cool.

Just outside the station, there’s this overpass on Yongmasan-ro, set among Seoul’s ever-present density.

IMG_1583

This view is from about the same place, back towards central Seoul.

IMG_1585

Density!

IMG_1586

Oh. Well, that’s hard to miss. This park and enormous dry waterfall were just steps away from the city. The falls were dry at that time of year (May) but they must be pretty interesting in the summer monsoon.

IMG_1589IMG_1590

A trail led up towards the top. Well, why not?

IMG_1594

If it looked like it was steep from far away, well it looked the same close up.

IMG_1597

Like LA, Seoul has many hills and small mountains that rise abruptly from the surrounding valleys. It only takes a little elevation and a little effort to get a great view of the city. This isn’t really that different than the view of Glendale from Mt Thom, right?

IMG_1599

Um, well, yeah, it is.

IMG_1608

Of course, after scrambling up to the top in flip flops like a fool, I came across this slightly more improved trail.

IMG_1618.JPG

The views from Yongmasan stretch across much of the city. Unfortunately it was foggy, and an iPhone 4 camera doesn’t really do it justice anyway.

IMG_1622IMG_1623

Descending the mountain (the right way), I came out to this street at the foot of the hill, with community garden plots. And lo, what is that, a four-story podium with open parking at the ground level!? Clad that thing in stucco and it’d be at home anywhere in LA! (Well, except for the zero setback.)

IMG_1631.JPG

It doesn’t take long to get back into the city.

IMG_1633.JPG

Tuck under parking is hugely popular in this neighborhood.

IMG_1638IMG_1636

Wandering south past Junggok Station, came across this way cool street arcade and vending area. Modern development is more likely to be malls… which are cool in their own way.

IMG_1641.JPG

After some food, I headed west to the Dongbu Expressway, which you certainly won’t be seeing featured in urbanist blogs about Seoul anytime soon.

IMG_1645

I crossed the river on Cheonho-daero, to Janghanpyeong, and – I swear I’m not making this up – randomly found the headquarters of the Seoul Metropolitan Rapid Transit Corporation, which runs the 5-6-7-8 subway lines. You’d never know that the 1-2-3-4 lines are run by a different agency. Maybe they cooperate with each other instead of engaging in turf battles that hurt riders?

IMG_1650.JPG

That’s it for this time. Next: back to Montreal!

El Niño Fever: Volume 2

January is behind us, so here’s another update on rainfall and this year’s El Niño. Yesterday’s storm proved to be underwhelming across much of metropolitan LA, though the mountains did get a good dose of rain and snow. Downtown LA recorded 0.43”, for a January total of 3.17” – just above the average of 3.12”. The bad news is that thanks to dry weather in November and December, LA is still about 3” of rain below normal for the water year.

LAraintable

In fact, we are actually behind where we were at this point in water year (WY) 2012-2013, which turned out to be the worst year of the drought. Not exactly inspiring. The good news, of course, is that being in an El Niño year gives us much better odds of having a wet February-May than we had over the last four years.

LAraingraph

I added the median to the graph in green for this update. Because of a few monster years, the rainfall distribution skews high; the median of just under 13” may be considered more typical than the average of just under 15”.

The other good news is that the season has not been so cruel to the rest of the state. Most of California is having an average to above average year, including much of San Diego County and the San Joaquin Valley. Much of the Sierra Nevada and the northern third of the state are at or above average – and being 25% above average there make a much bigger difference.

WYtodate-20160201

This has helped replenish reservoirs, especially in northern California. Lake Shasta and Lake Oroville, the two biggest reservoirs in the state, will soon have more storage than they had at the end of spring last year. Folsom Lake and Bullards Bar have actually crept above the historical average.

This slideshow requires JavaScript.

We’re including San Luis Reservoir (a large off-line reservoir in the southern Central Valley) in NorCal, because that’s where the water comes from. It’s below where it was last year but that’s likely due to restrictions on when water can be pumped.

Reservoirs in the central Sierra haven’t done as well, partly because they were all very low, and probably partly because the terrain is higher and more of the precipitation has fallen as snow.

This slideshow requires JavaScript.

This year, the state’s snowpack is in much better shape than it was last year, so there will be a good bit of water headed to the reservoirs this spring.

In the meantime, if El Niño is going to make a dent in LA’s drought, it might want to start soon.