
Six months have passed, so it’s time for another LACMTA bus ridership update. As always, we start with the raw data. Highlighted cells represent the top 10 months for that route (since January 2009).

Here are the weekday, Saturday, and Sunday 12-month rolling averages.
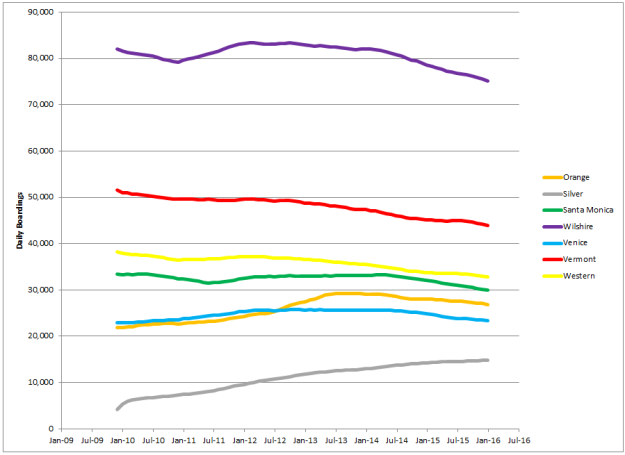


There’s not much new to say, so we’ll keep it short. Most lines continue to decrease. The Silver Line continues to grow slowly. Rolling 12-month average weekday ridership has declined by over 8% on the Orange Line and 10%-15% on the other lines, except the Silver Line which has set new record highs. A glance at the raw data above reveals that these numbers are about to get a lot worse unless something changes soon.
Here’s the percentage of trips on each arterial being served by the rapid route.

The share of riders served by the rapid routes continues to slowly rise on most corridors. This doesn’t necessarily mean increasing ridership on the rapid – it could be that both the rapid and local declined, but the rapid was more resilient. For example, here’s the split for Wilshire, where the Westside local (Route 20) has been fairly steady, the Rapid (Route 720) has seen a modest drop, and the heaviest drop has been on the east side local (Route 18).

That’s it for now; next up, Valley bus ridership.

Pingback: Today’s Headlines | Streetsblog Los Angeles
Troubling for future busways in that Wilshire is dropping a lot after the implementation of the bus lanes.